
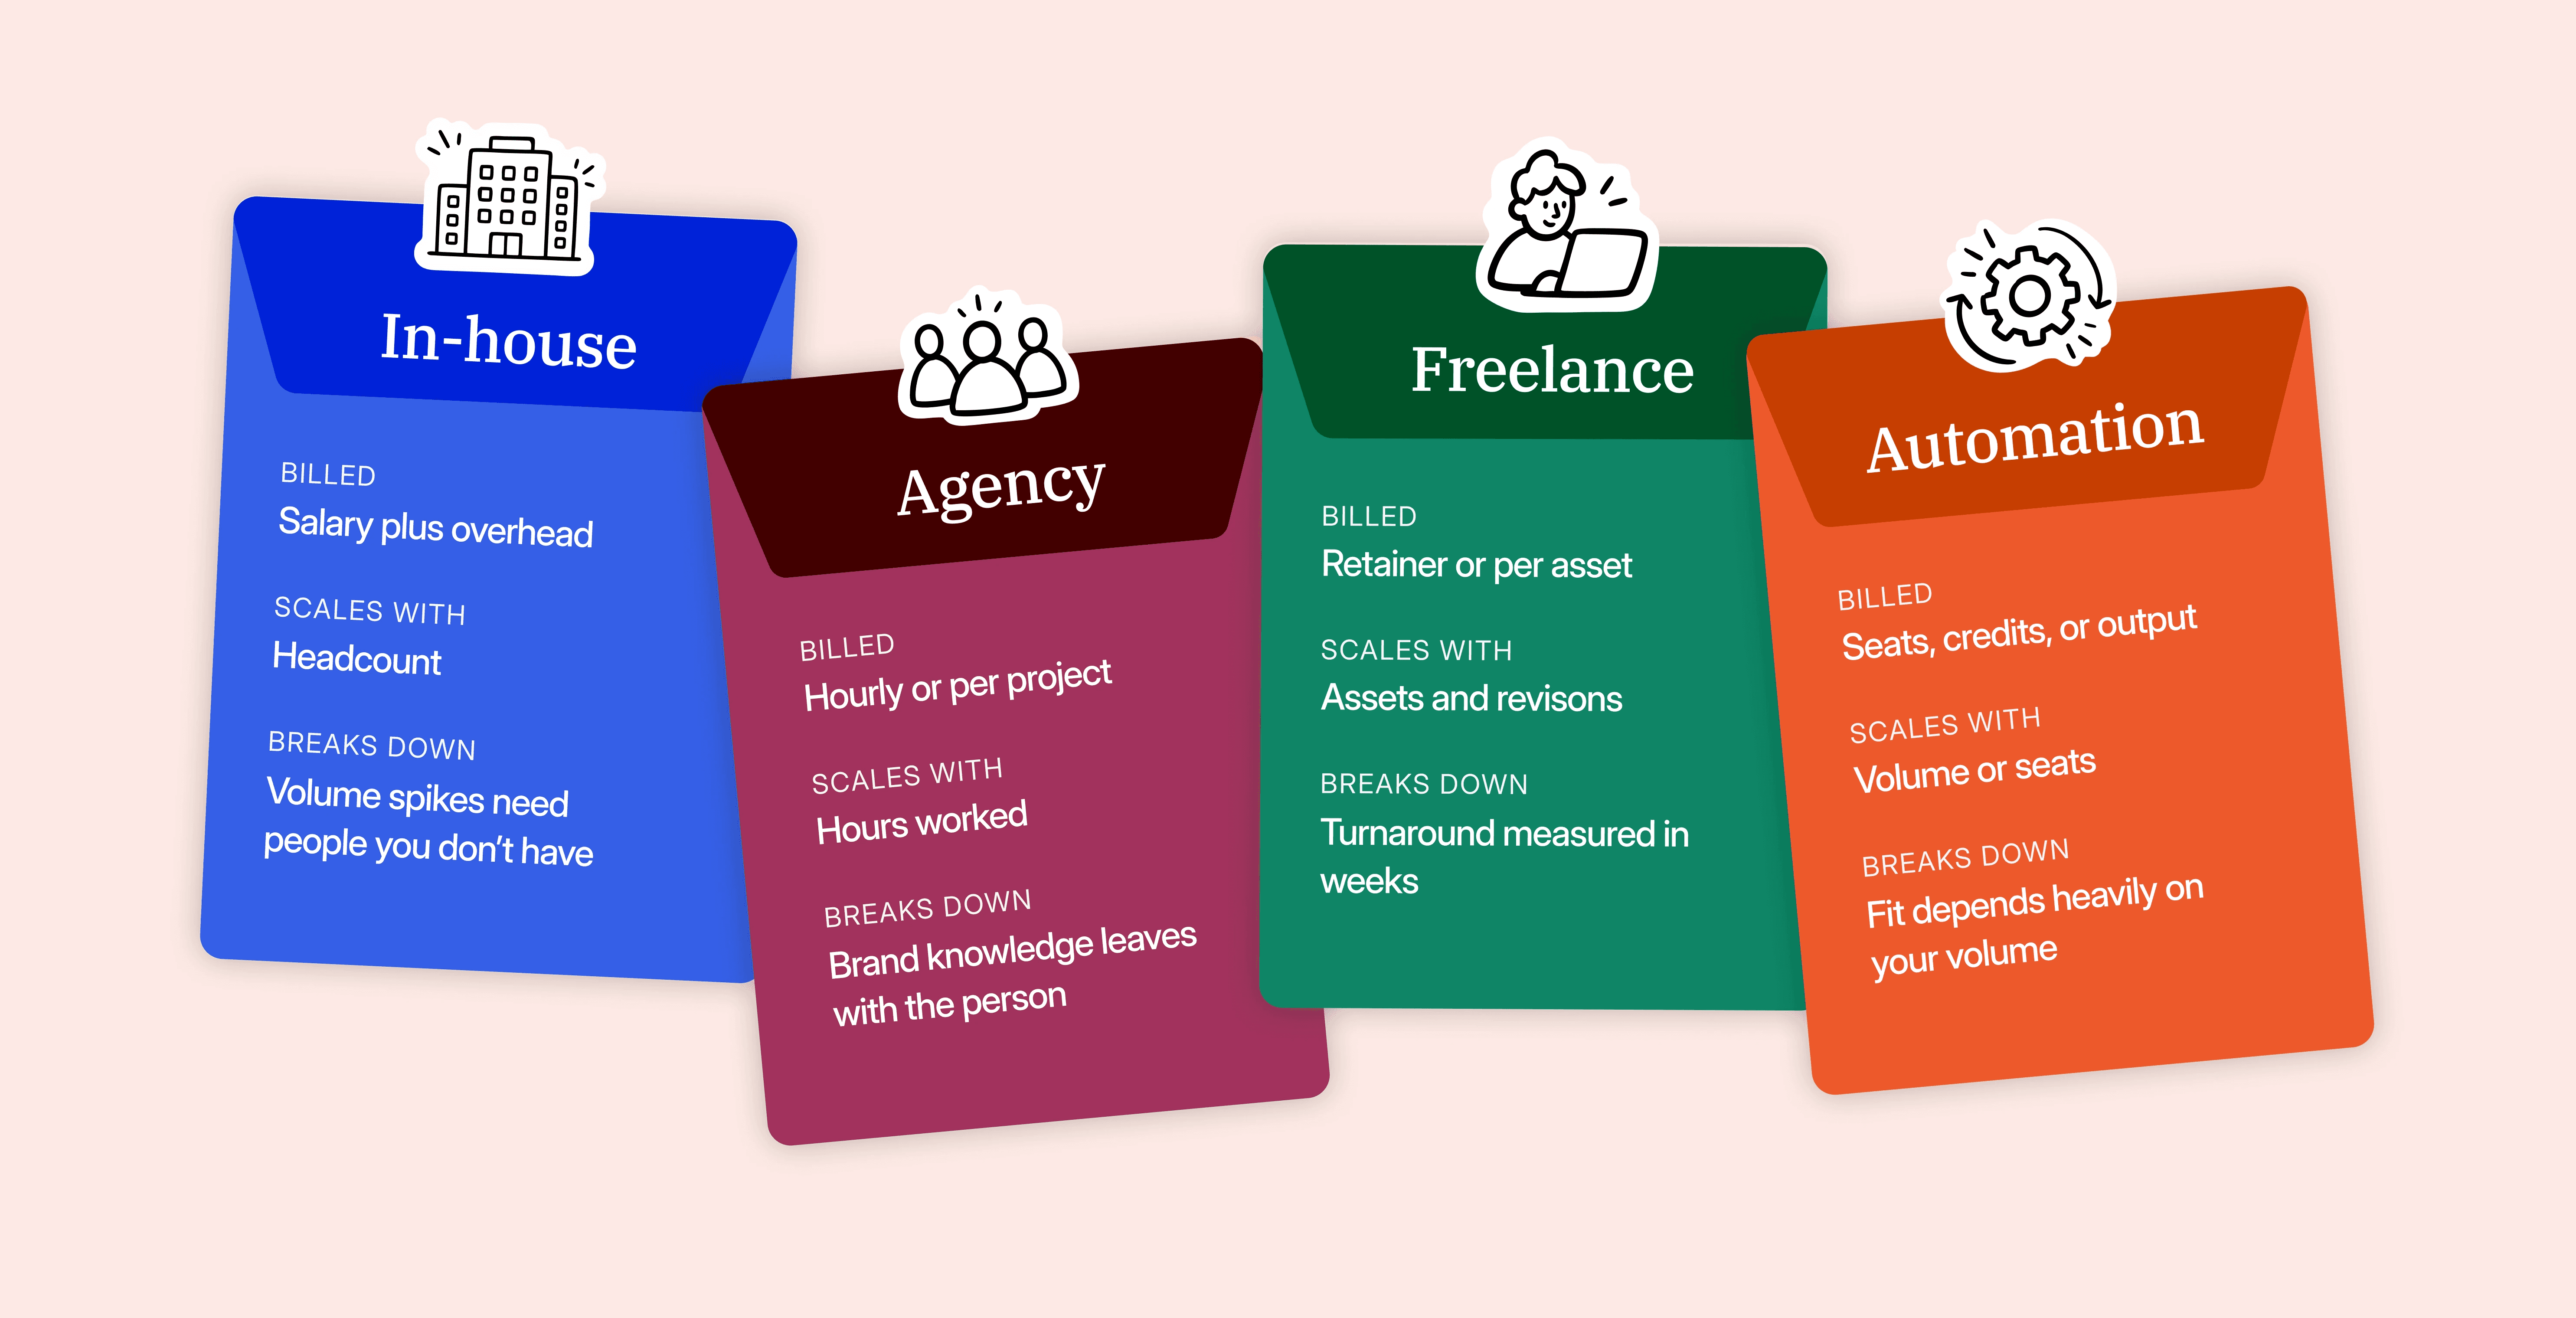
E-commerce teams feel the same cost differently
For e-commerce, the production problem usually shows up as coverage.
One product launch may require product detail page assets, A+ content, retailer-specific imagery, paid retail media, mobile formats, regional copy, and localized versions. The master design may be approved, but each retailer and market introduces another set of production requirements.
A delay in one creative queue can leave a launch partially live: new product page, old media assets; updated Amazon imagery, outdated Walmart content; US launch complete, localized versions still waiting.
That isn't simply a design problem. It affects how quickly the commercial plan reaches every placement it was intended to cover.
This is why creative versioning is often where the economics become easiest to see. Once the concept is approved, every manual resize, copy change, language version, and retailer adaptation adds production cost without adding a new creative idea.
One master into 20 versions shows what you're paying for
Suppose one approved campaign master needs 20 static adaptations across Amazon, Walmart, paid social, and other placements.
With an internal team, a designer opens the master, makes the required changes, checks each format, exports the files, and handles corrections that come back through review. The cost is mostly internal time.
With an agency, much of the same work becomes a production fee, along with the turnaround and revision cycle built into the agency process.
A self-serve automation tool can reduce the mechanical work, though somebody still operates the templates, checks the output, and prepares the final assets.
Under AI Studio's current pricing, 20 straightforward static image adaptations would start at 20 credits, or $180. Credits may vary with complexity, so this is an illustrative starting point rather than a universal quote.
The real comparison is $180 against the cost of getting those same 20 approved assets live through your existing workflow.
If your current process needs several hours of designer time, an agency production fee, two rounds of review, and a retailer correction, all of that belongs in the comparison.
The hidden cost usually sits in the work that remains manual
Software can look inexpensive until you add the operating model around it. Three areas tend to change the real first-year cost.
Dynamic templates and system integration
Creative automation needs structured inputs to produce reliable output.
Dynamic templates may need rules for copy length, product imagery, logo placement, optional elements, safe areas, naming, and different formats. If you run dozens of recurring campaign types, somebody has to build and maintain those templates.
System integration can add more work. Product feeds, digital asset management systems, content management systems, customer data, or campaign inputs may all need to flow into the production process.
The more systems involved, the more useful it is to ask who owns each connection once implementation is over.
If your IT team has to maintain custom integrations and creative ops has to repair templates every time a platform changes a specification, those resources belong in the cost calculation.
Brand governance and quality assurance
Automation increases the speed at which errors can multiply as well as the speed at which correct assets can be produced.
For global brands, maintaining brand consistency may involve typography, logos, product imagery, legal copy, retailer rules, required disclaimers, regional claims, and different languages.
Some of those checks can be automated. Others still require judgment.
Review capacity therefore belongs in the production model. If the platform can create 500 outputs in an afternoon but your team spends two days checking every one manually, the bottleneck has moved downstream.
Track approved output rather than generated output.
Ongoing support
Templates change. Retailers change specifications. Products get new packaging. Brand guidelines evolve. New markets introduce another layer of requirements.
Someone has to own those changes.
A software-only creative automation platform may leave more of that work with your creative ops team. A managed production model may include template maintenance, production support, and quality assurance in the service.
Neither model is automatically better. The question is which internal job you are prepared to keep.
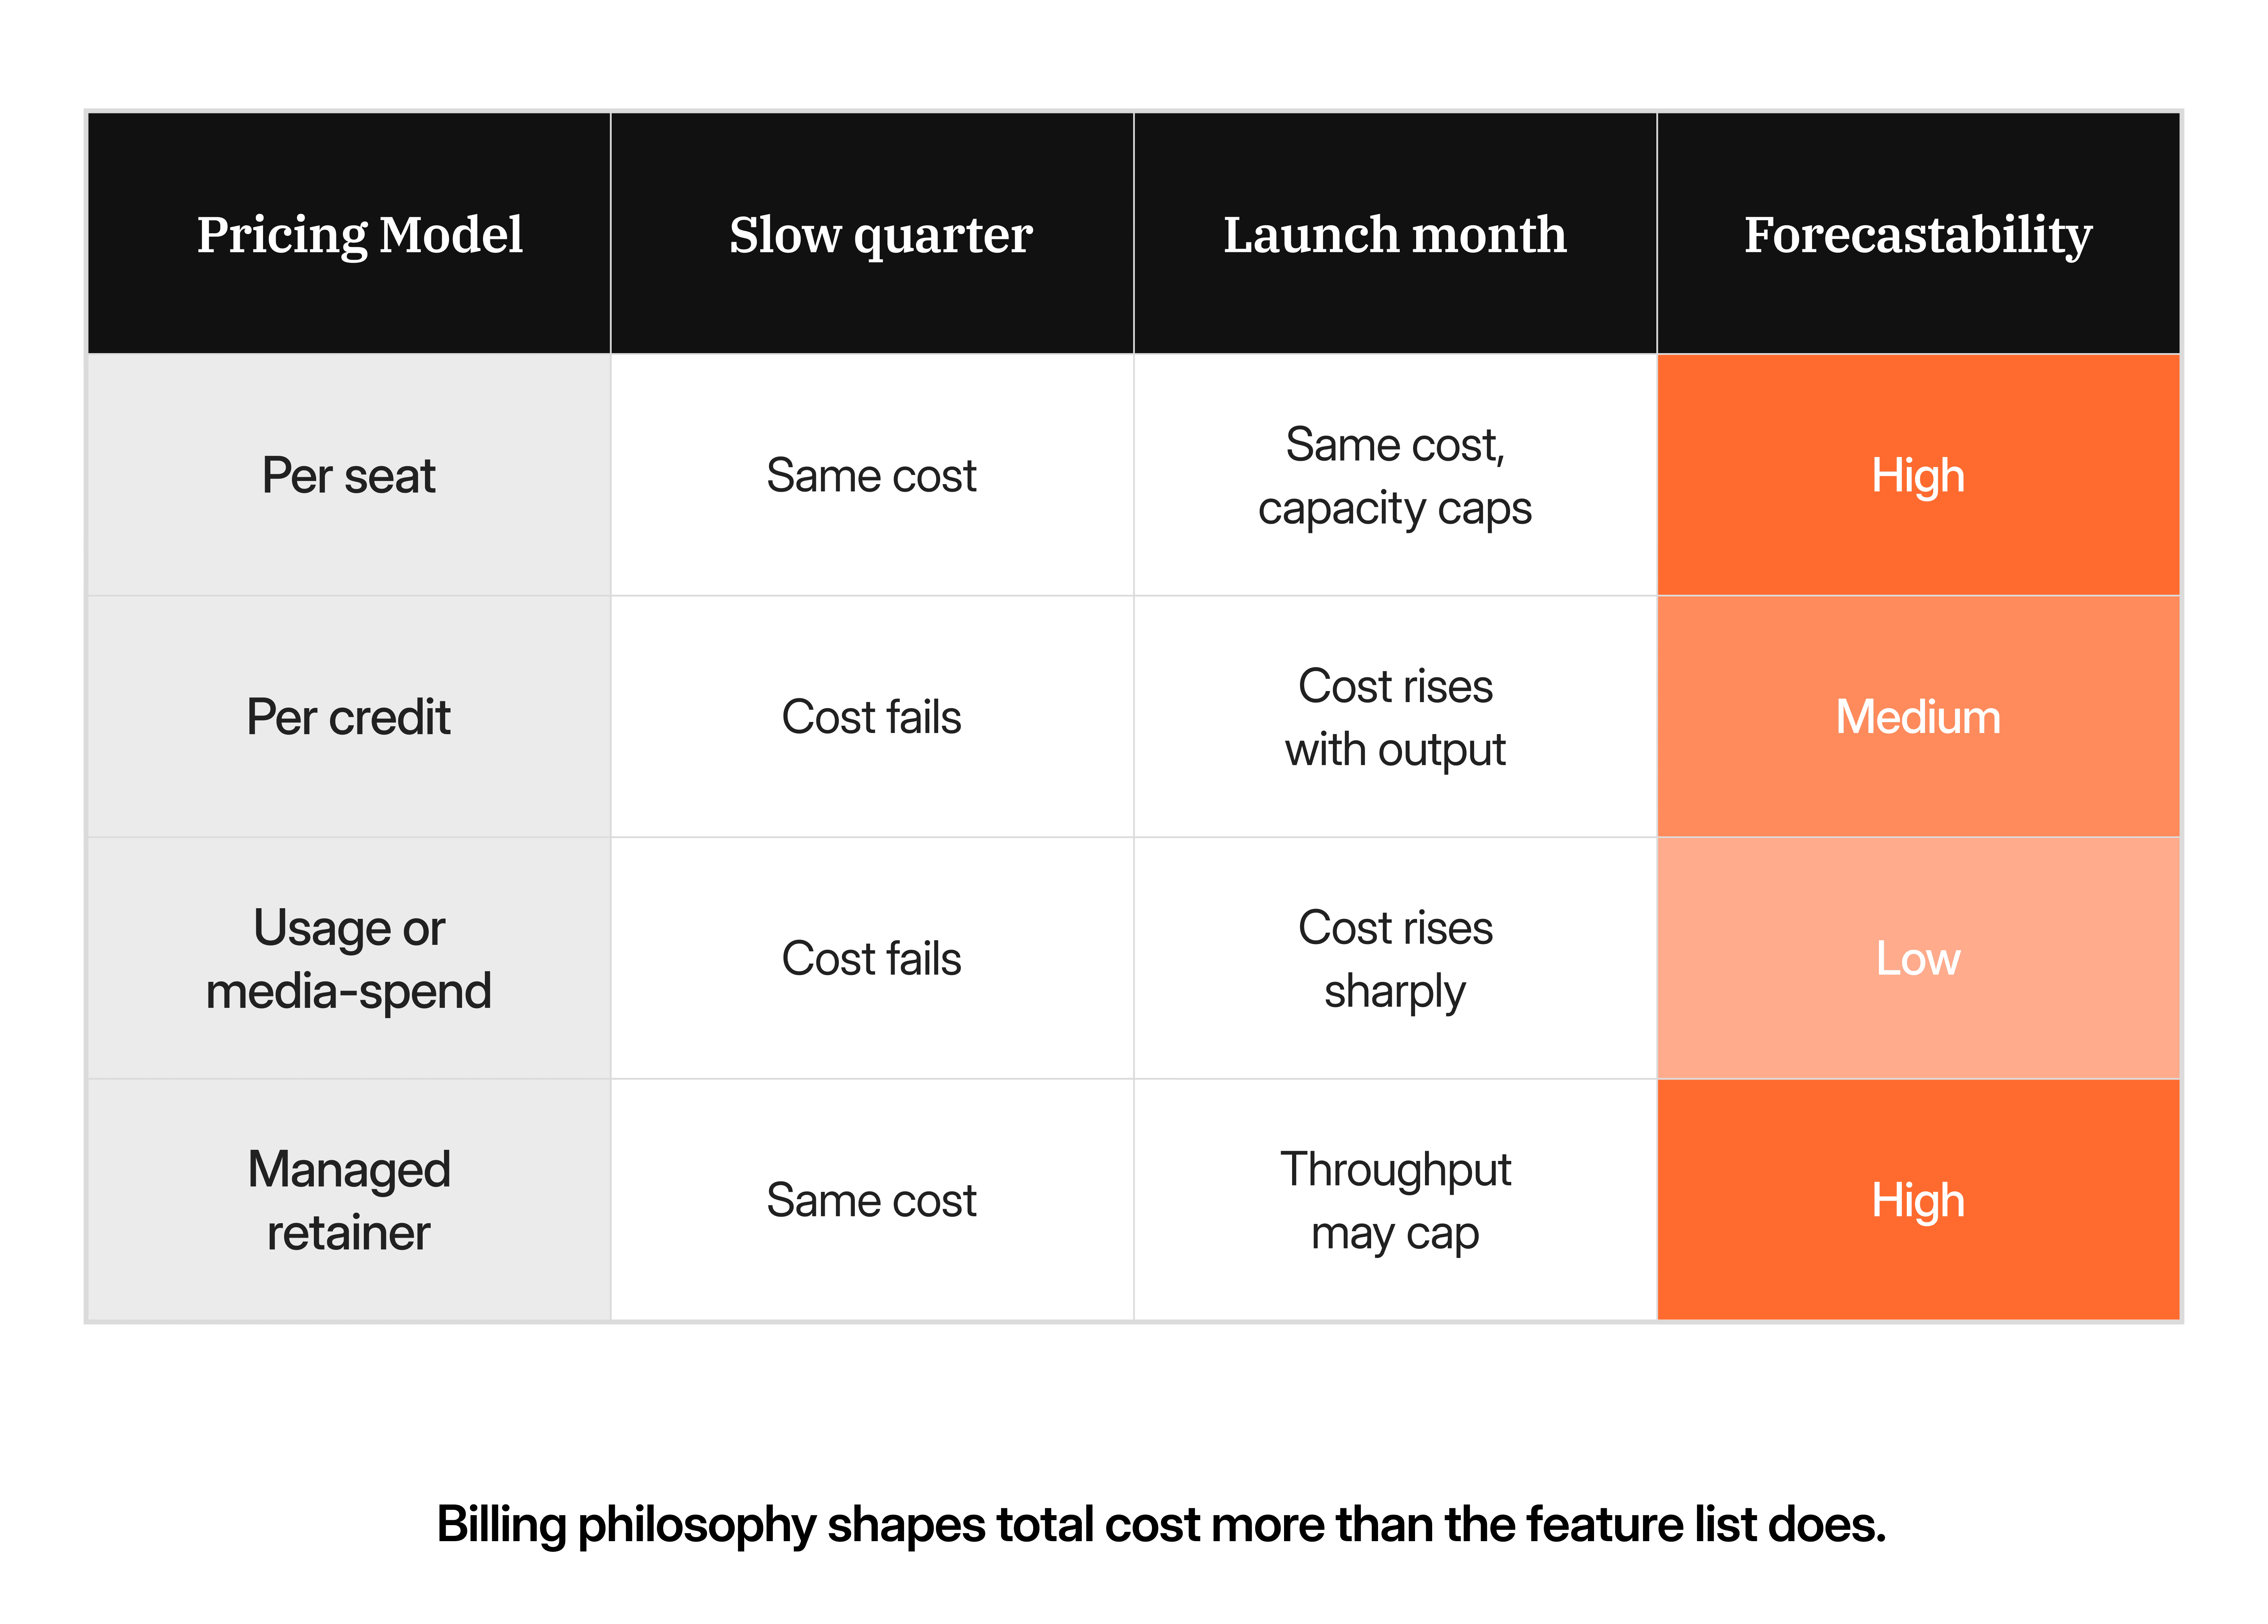
Pricing models behave differently when campaign volume spikes
Creative production rarely arrives evenly across twelve months.
Prime Day, product launches, seasonal campaigns, retailer promotions, and localization projects create sharp increases in demand. That makes the billing model part of the operational decision.
Pricing model | Quiet month | Launch month | Best fit |
|---|---|---|---|
Per seat | Cost stays fixed | Cost stays fixed, but human capacity can cap output | Stable internal teams |
Flat subscription | Cost stays fixed | Usage limits may appear | Predictable production |
Credit or output based | Lower usage | Spend rises with production | Variable campaign demand |
Managed retainer | Same spend | Throughput limits may apply | Consistently high demand |
Media-spend linked | Cost falls | Cost can rise sharply | Dynamic campaign use cases |
Per-seat software can be easy to forecast, though production output still depends on the people operating it.
Credit-based pricing follows actual volume more closely. That can suit teams whose creative demand rises around launches and campaign windows, but finance will want a credible forecast.
Build that forecast from your production mix: static adaptations, localized versions, video, new layouts, and the number of markets or channels involved.
Once those numbers are visible, a credit model stops being abstract.
Calculate payback with cost, speed, and output
A simple payback model needs six inputs:
Current annual creative production spend
Current number of approved assets shipped
Current cost per approved asset
Expected production volume after automation
Expected cost per approved asset under the new model
Implementation and ongoing operating cost
Those numbers tell you when cumulative savings recover the implementation cost.
They don't tell you whether marketing can move faster.
Add two operational measures: time from brief to approved asset and approved assets shipped per month.
For a paid team, that shows whether you can launch more tests and move winning creative into additional placements faster. For e-commerce, it shows whether more retailer and market updates can go live within the same launch window. Creative ops can see whether repetitive production is actually leaving the internal queue.
The business case gets stronger when all three improve together.
Where AI Studio fits
AI Studio uses a credit-based model with no per-seat fees.
Pricing starts at 1 credit, or $9, for a static image adaptation. Credits are consumed only when a finalized asset is exported, so iterations, internal edits, and review rounds do not use additional credits.
A video under 15 seconds uses one credit, while a video over 15 seconds uses two. Larger or custom projects may require more credits depending on complexity.
The service also includes the production work around those outputs. AI agents handle templating, resizing, versioning, compliance checks, file naming, and compression, while human experts review every asset before it reaches the customer.
That split matches how Rocketium describes its production model internally: AI handles the mechanical execution while human designers perform the final quality review against the brief, brand, and channel requirements.
Every plan also includes an Account Director, Creative Strategist, Project Manager, Designers, AI Engineers, and QA, along with self-serve editing, unlimited users and storage, brand and platform configuration, asset management, and 24/7/365 coverage.
The model is most relevant when repetitive production has become the constraint. If you only need a few assets each month and your designers have room in the schedule, a lightweight automation tool or freelancer may be more economical.
Major campaign concepts are different again. An agency or internal creative team may still be exactly where you want the strategic and creative thinking to happen.
AI Studio can sit alongside that work rather than replacing it. Rocketium's own positioning treats agencies and internal teams as potential owners of strategy and optimization while AI Studio handles production where capacity is tight.
What this looks like at scale
The value becomes easier to see once production volume is high enough to constrain campaigns.
Twelve Amazon teams produce roughly 250,000 assets a year through Rocketium. Samsung has gone from a brief to 500 approved assets in under an hour. MegaFood refreshed creative for more than 100 Amazon listings in under a month after a comparable freelancer process had taken eight months, while reducing cost by 30%.
Those results aren't a universal ROI forecast.
They show the operational change a finance model should account for. Lower unit cost is one benefit. More approved creative reaching the market while the campaign opportunity is still current can be the larger one.
Test the model on a brief you've already run
You don't have to estimate every variable before finding out whether the model works for your team.
Use a brief you've already completed. You know the previous cost, turnaround, review burden, and final quality, so the comparison starts with real numbers rather than assumptions.
AI Studio currently gives new teams 100 free credits to start. A pilot uses a brief you've already executed, returns assets in 24 to 48 hours, and requires about 40 minutes from your team.
Compare the new process against the old one on four measures:
final quality
time from brief to approval
internal effort
cost per approved asset
If the numbers don't improve, the case is weak.
If they do, the conversation with finance becomes much more concrete: here is what we're paying today, here is what the same work costs under the new model, and here is how much additional campaign output the same team can support.
Frequently asked questions
How much does creative automation cost?
Creative automation pricing depends on how much of the production process the vendor handles. Self-serve tools often charge monthly or per seat, while enterprise platforms may combine subscriptions and usage pricing. AI Studio starts at 1 credit, or $9, for a static image adaptation, with larger or more complex work using additional credits.
What should I include when calculating creative automation cost?
Include the vendor fee, dynamic template setup, system integration, internal IT and creative ops time, approval workflows, brand governance, quality assurance, training, ongoing maintenance, and any production work your team still performs manually.
Is creative automation cheaper than an agency?
It can be for recurring production such as resizing, versioning, localization, PDP refreshes, retailer-specific formats, and high volumes of creative variations. Agencies may still be the better investment for major campaign concepts, brand strategy, and lower-volume work that depends heavily on senior creative judgment.
Does creative automation improve ROAS?
Creative automation doesn't improve return on ad spend on its own. Its contribution is production capacity: more creative tests, faster adaptation of winning ideas, and quicker refreshes when performance starts to decline. Whether that improves ROAS depends on the quality of the creative and how the additional testing capacity is used.
How should performance marketers evaluate creative automation?
Look at cost per approved asset, time from insight to live creative, the number of tests you can launch within a campaign cycle, and how quickly winning creative can be adapted across placements and audiences. Those measures connect creative production directly to paid-media operations.
How do I justify creative automation to finance?
Start with current production spend and approved asset volume to establish your cost per asset. Compare that with the expected unit cost, implementation cost, and projected output under the new process. Include changes in turnaround and production capacity so finance can see what the same budget can put into market rather than evaluating the software fee in isolation.