
Updated On:
Written By

" height="20px" id="fXPtLeYUp" width="20px"/></svg>)
Co-founder and CPO
Reviewed By

Co-founder and CEO
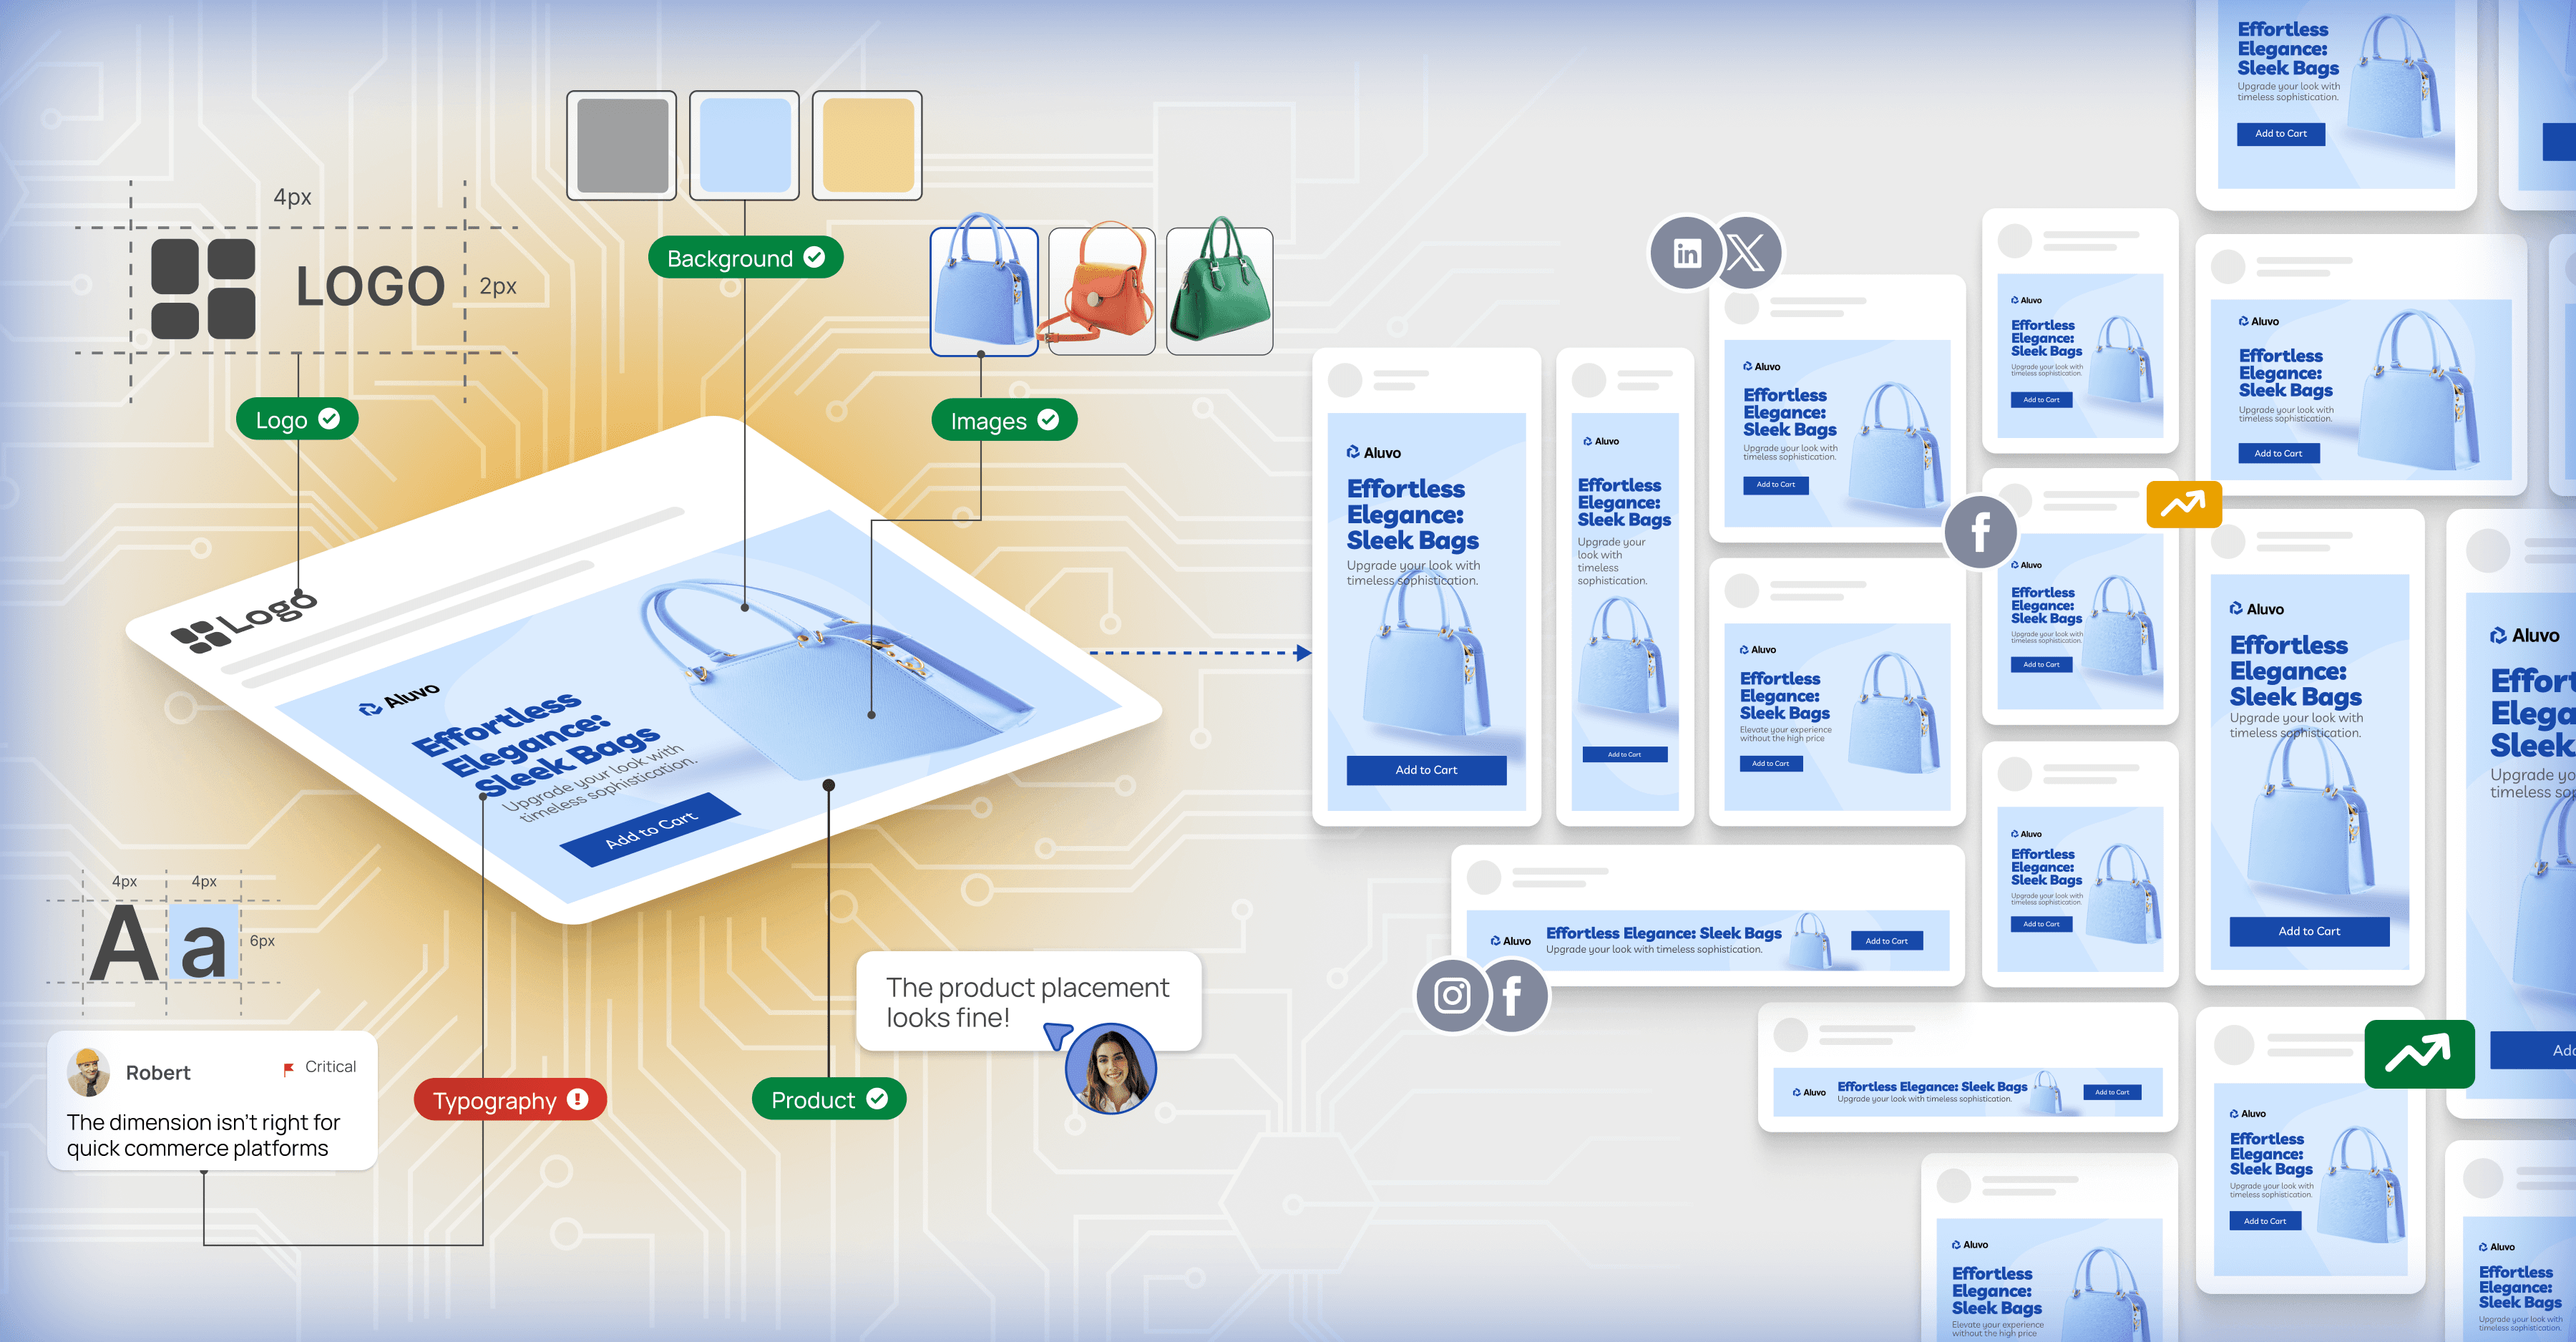
Every day, marketing teams waste 73% of their creative production time manually resizing assets across format variations. The conventional approach of hiring more designers or using rigid templates fails at scale. We reject this inefficiency.
Through a three-tier intelligence system combining algorithmic resizing, vector similarity matching, and LLM-based generation, Rocketium's AI Auto Adapt processes 10,000+ creatives daily with 95% accuracy in 3 seconds average processing time. This isn't incremental improvement. It's a fundamental reimagining of creative automation through mathematical rigor and distributed intelligence.
The creative resizing crisis
Modern marketing operates at unprecedented scale. A single campaign may need 50+ format variations across platforms - Instagram stories, Facebook feeds, Google display ads, LinkedIn carousels, and countless other specifications. Each format demands unique aspect ratios, element positioning, text sizing, and visual hierarchy adjustments.
Consider the combinatorial explosion. A brand with 10 core creative concepts, adapted across 50 formats, with 5 messaging variants, requires 2,500 unique creative assets per campaign. Manual production at 15 minutes per adaptation would consume 625 hours of designer time equivalent to 15.6 weeks of full-time work for a single campaign.
This scalability crisis demands algorithmic solutions. But naive automation of simple image scaling or template-based approaches fails catastrophically when faced with the nuanced requirements of modern creative adaptation.
The three-path intelligence architecture
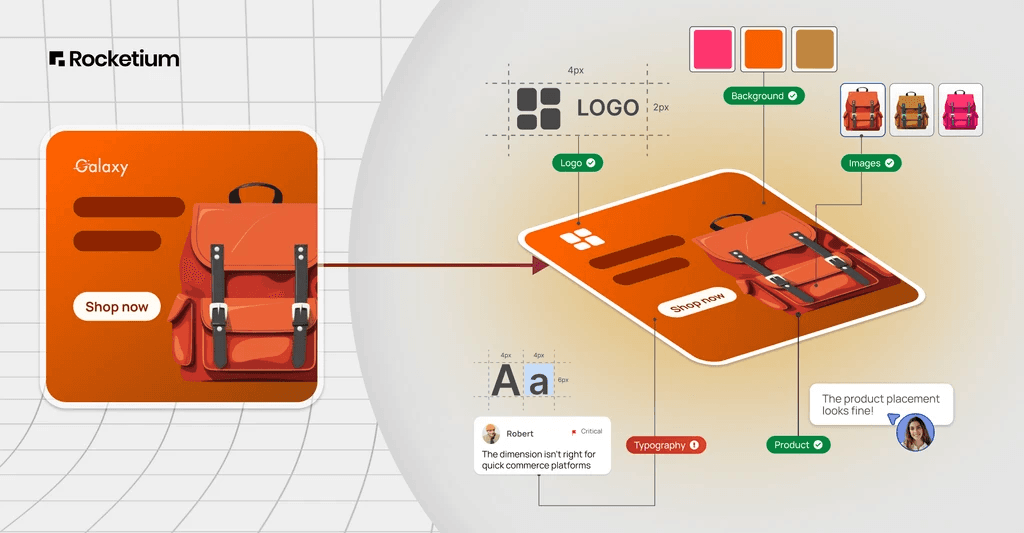
Rocketium's AI Auto Adapt recognizes a fundamental truth - different creative challenges require different types of intelligence. Rather than forcing all adaptations through a single algorithmic approach, our system provides three distinct methods, each optimized for specific creative scenarios and user preferences.
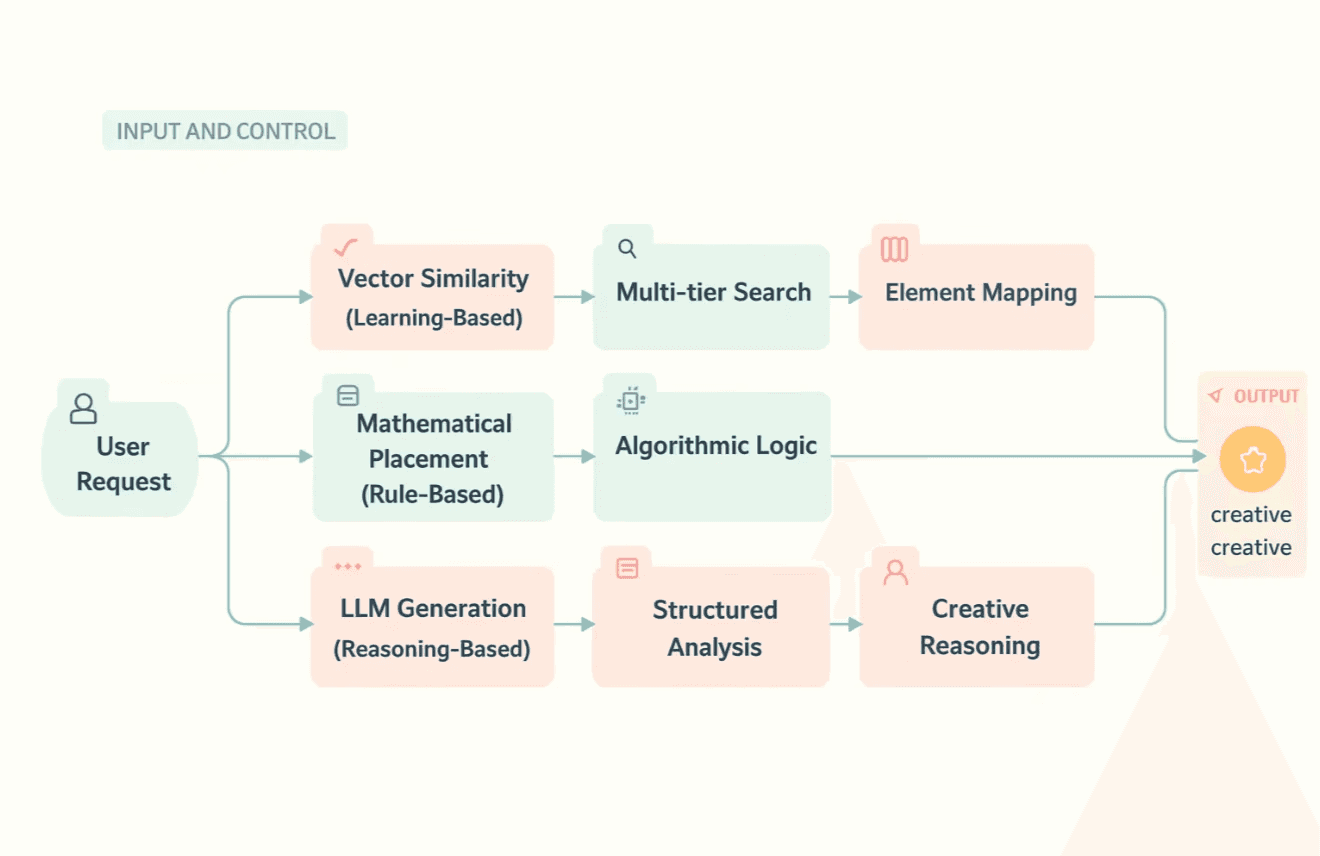
This architecture embodies a critical design philosophy - user agency over algorithmic assumption. Different creative teams have different priorities - speed vs. precision, consistency vs. creativity, learning-based vs. rule-based approaches. Our system provides choice rather than imposing a one-size-fits-all solution.
Approach 1 - Algorithmic placement
The similarity trap in creative resizing
In creative resizing, “similarity” is often treated far too simplistically. Many auto-adapt systems still rely on naive rules like matching by aspect ratio or proportional scaling to resize a design from one format to another. The result? A movie poster squeezed into an Instagram Story looks nothing like the original, or a carefully balanced banner loses its hierarchy when stretched into a square. These are not minor glitches. They are the inevitable outcome of treating similarity as a one-dimensional property when, in reality, it is multi-faceted and context-dependent.
Naive similarity assumes that two canvases are “close enough” if their width-height ratios align, but this ignores composition, grouping, visual hierarchy, and edge attachments. A 16:9 poster and a 1080×1920 Story may appear mathematically “similar,” yet visually they are worlds apart. This is the similarity trap - the mistaken belief that a single metric can capture the complex nature of design adaptation.
Our approach to creative resizing escapes this trap by redefining similarity across multiple dimensions. Instead of relying on ratio alone, we layer in Euclidean distance for size matching, weighted aspect ratio alignment, quadrant-based positioning, edge-attachment preservation, background detection, and mathematically precise group handling. Together, these techniques ensure that adaptations aren’t just resized they remain faithful to the intent, hierarchy, and usability of the original design.
Escaping the similarity trap
When adapting creatives across formats, “similarity” can’t be captured by one naïve metric. Instead, we need a layered approach: start with raw geometry, refine with proportions, preserve layout semantics, enforce design heuristics, and end with structural cohesion. Each stage fixes a limitation of the one before it.
Step 1 - Building on geometry with euclidean distance
The first way to compare two sizes is by treating width and height as points in a plane and measuring how far apart they are. This gives us a geometric sense of closeness. We measure closeness of two sizes (w₁, h₁) and (w₂, h₂) as

Example
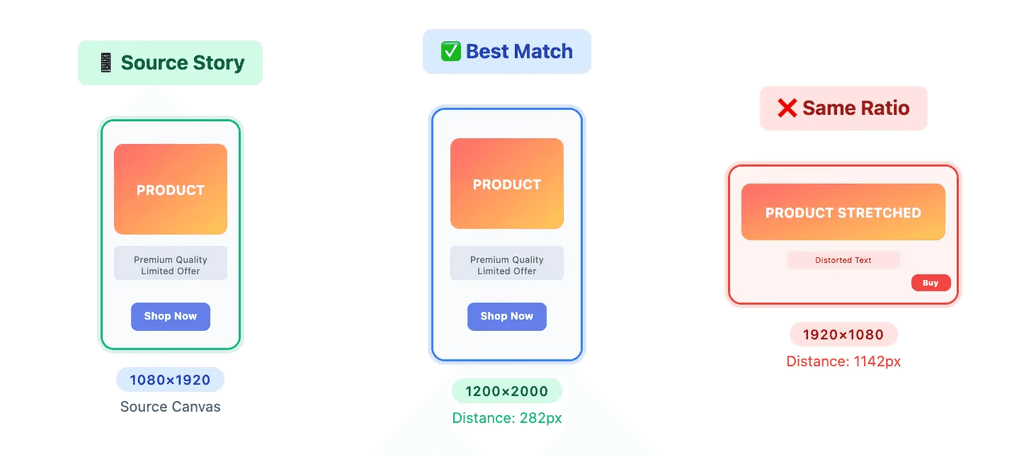
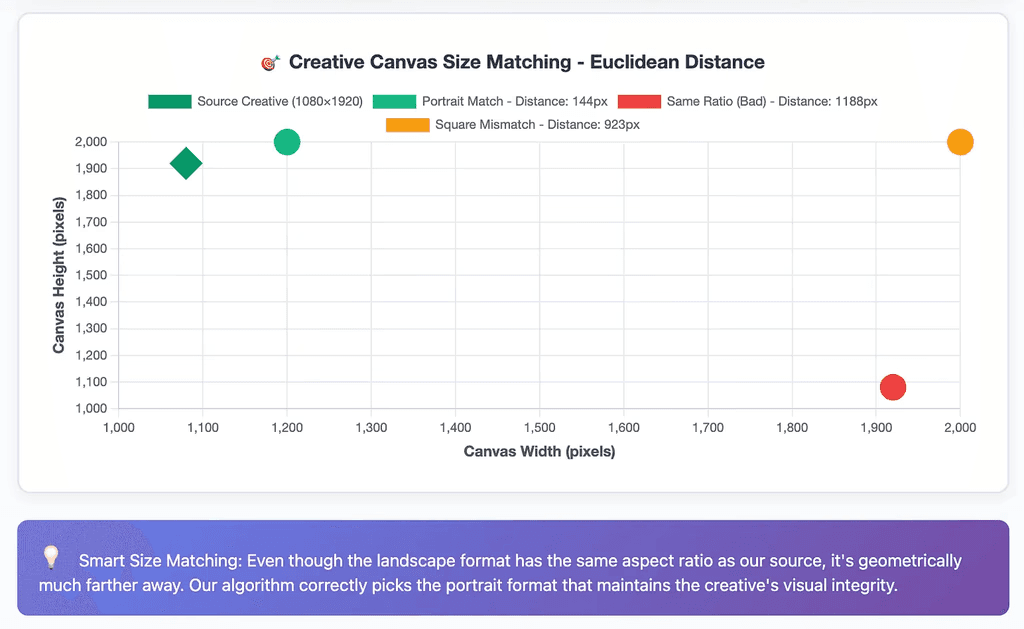
Source = 1080×1920
Candidate A = 1200×2000 → dA≈144
Candidate B = 1920×1080 → dB≈1188
Candidate A is much closer in terms of raw dimensions.
Euclidean distance is a good first filter to discard wildly mismatched canvases. But geometry alone is blind to proportions. A square can appear “close” in pixels yet look completely different.
Step 2 - Balancing size and shape with weighted aspect ratio
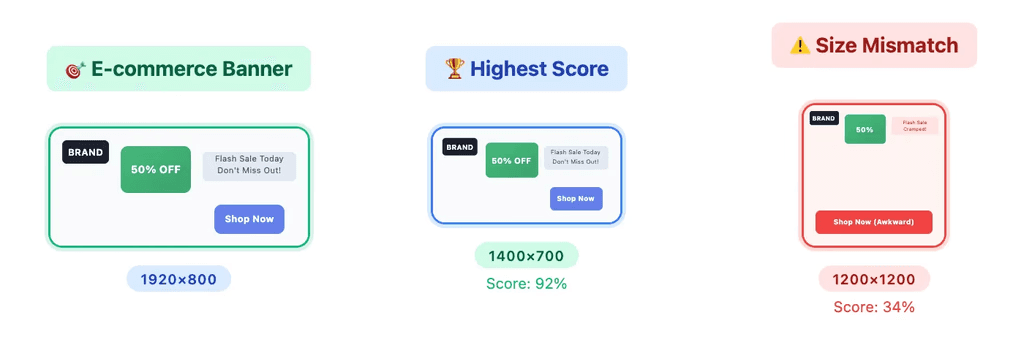
Once we establish a geometric baseline, we add proportion awareness. When adapting creatives, shape similarity (aspect ratio) often matters more than absolute size. A 4:5 portrait feels much closer to a 9:16 story than a 1:1 square, even if the square is dimensionally closer. To capture this, we combine aspect ratio closeness with distance closeness.

where α and β are empirically tuned weights balancing proportional accuracy and spatial stability.
Aspect ratio closeness
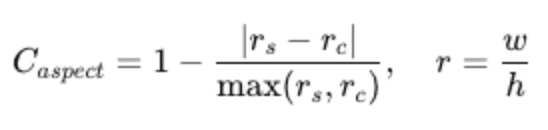
Distance closeness

Weighted scoring prevents us from picking technically close but visually mismatched sizes. Still, this only helps us pick the right canvas. It doesn’t preserve element placement.
Step 3 - Preserving composition with quadrant-based positioning
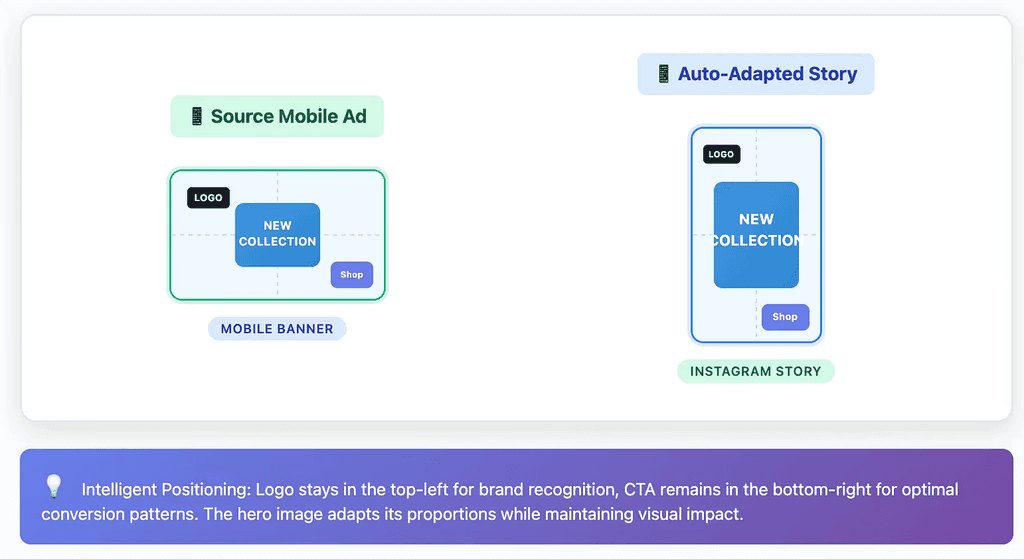
Naïve scaling assumes everything moves proportionally, but creatives have structure. Elements belong to zones top-left for logos, bottom-right for CTAs, center for products. Quadrant mapping ensures those relationships survive resizing.
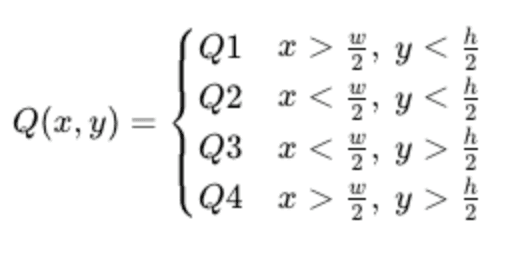
Example
A CTA sits in the top-right of a 1920×1080 banner. Naïve scaling pushes it downward in a tall 1080×1920 Story. Quadrant mapping keeps it anchored in the top-right.
This step preserves composition and hierarchy. It respects visual intent, but there are still cases like edge logos or backgrounds that require special handling.
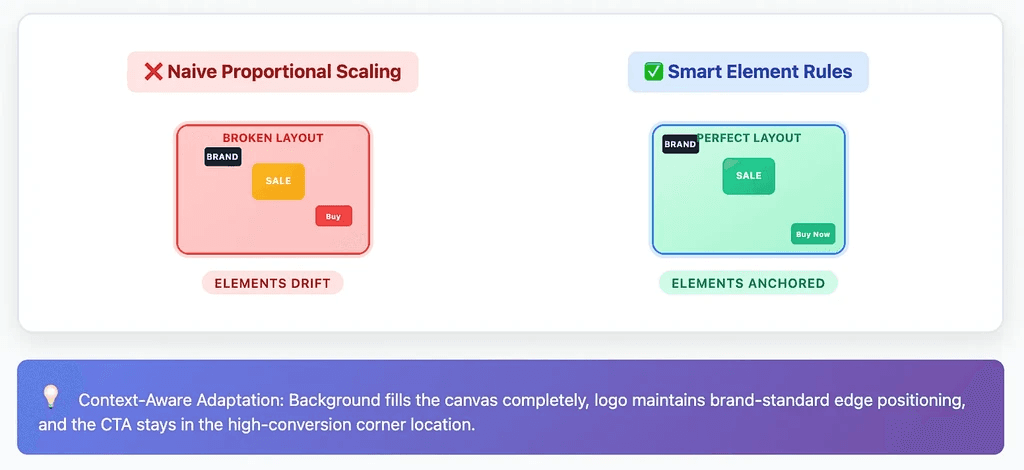
Step 4 - Keeping anchors stable with edge and background rules
Some elements don’t just live in a quadrant they hug an edge or fill the canvas. These need rules beyond proportional math.
Edge attachment
If an element touches the boundary in the source, it should stay pinned to the boundary in the target.
Background detection
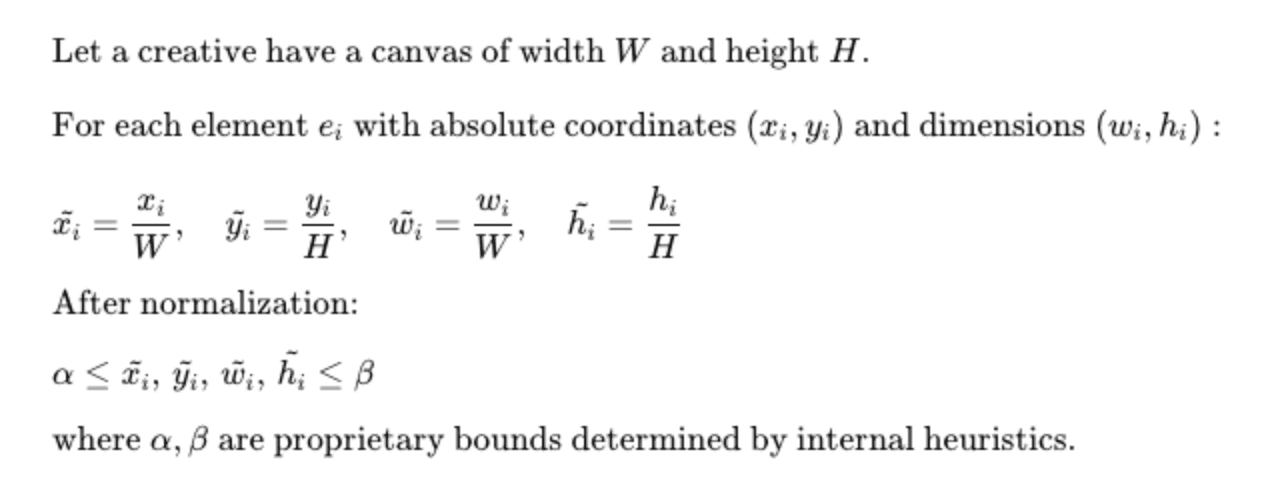
When an element’s area dominates the canvas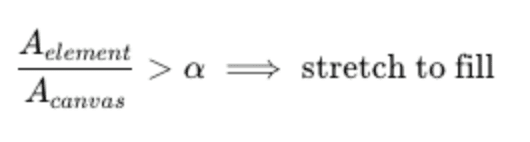
α is determined through a proprietary calculation that takes into account multiple visual and spatial parameters.
Example
A logo sitting at the top-left of a 600×400 ad remains top-left in the 1080×1920 version.
A background photo covering
αof the canvas is stretched to fill the new format.
This ensures brand marks and backgrounds behave predictably. But if a logo includes both icon and text grouped together, naïve scaling can still break their proportions.
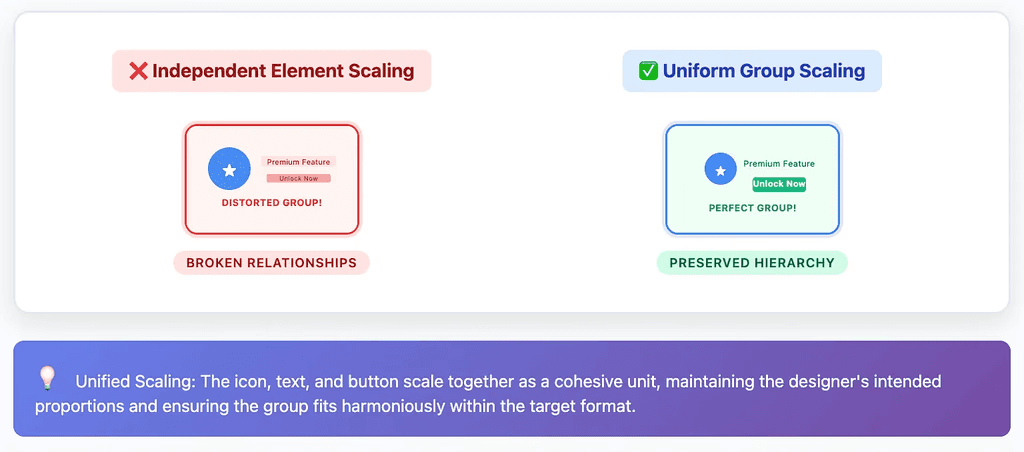
Step 5 - Maintaining cohesion with group scaling
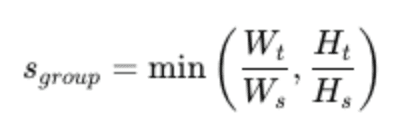
A final refinement ensures that groups of elements (like buttons, badges, or icons with labels) scale as a single unit rather than drifting apart.
Example
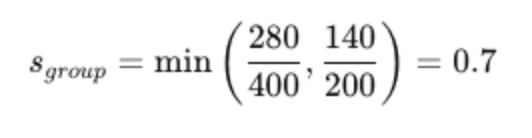
A button group is 400×200 in the source and must fit into 280×140.
From distance to design
Geometry filters mismatches.
Aspect ratio adds proportional sensitivity.
Quadrants preserve layout intent.
Edges and backgrounds enforce design heuristics.
Group scaling maintains cohesion.
By layering these steps, we move from flat heuristics to a multi-dimensional framework that balances math with visual meaning. This is how we escape the Similarity Trap.
Recent Posts
Explore expert insights, creative strategies, and practical guides to help your brand create better content and scale faster.