
The typical approach to Amazon PDP improvement goes like this: a brand manager looks at the listing, compares it to a competitor who seems to be doing well, copies a few elements, and moves on. Three months later, conversion has not changed meaningfully. The brand blames the algorithm, the category, or the price.
The real problem is that PDP performance is not driven by any single element. It is the result of how seven distinct visual systems work together. A listing can have a perfect hero image and still underperform because its A+ content lacks a comparison chart, or because its gallery does not address the category's primary purchase barrier, or because the text in its infographics is illegible on mobile.
Isolated fixes produce isolated results. Systematic evaluation produces systematic improvement. This article introduces a structured framework for evaluating and improving Amazon PDP assets. It covers the seven pillars that determine whether a listing converts or gets scrolled past, the specific criteria within each pillar, and the research evidence behind them. At the end, you will find a scoring rubric you can apply to your own listings today.
🔍 When to run a PDP visual audit
Before a product launch or seasonal refresh
When conversion rate drops without a clear cause (pricing, reviews, stock)
After a competitor significantly updates their listing
Quarterly, for your top 10-20 SKUs by revenue
When expanding to a new retailer (the framework applies beyond Amazon with retailer-specific adjustments)
The 7-pillar framework
This framework evaluates Amazon listings across seven pillars, each scored on five criteria using a 1-5 scale (35 criteria total, 175 points maximum). The pillars and their evidence base are summarized below with a detailed scoring guidance after it.
Pillar | What it measures | Why it matters |
|---|---|---|
P1: Hero image quality | Technical compliance, photography quality, product clarity, CTR optimization, format accuracy | Viewed by 95%+ of PDP visitors (Baymard Institute). Primary determinant of click-through from search results. First impression formed within 50ms (Nielsen, 2023). |
P2: Image gallery depth and strategy | Slot utilization, lifestyle imagery, feature infographics, ingredient/provenance imagery, video presence | Gallery slots 2-4 receive 3x more engagement than slots 5+ (Baymard). Video increases conversion by up to 9.7% (Amazon). |
P3: A+ content quality and completeness | Presence, visual quality, comparison chart, Brand Story module, mobile optimization | A+ content correlates with 3-10% conversion uplift (Amazon). 37% of shoppers abandon a PDP when they cannot determine which variant fits their need (Baymard). |
P4: Trust signals and credibility | Third-party certifications, clinical/scientific claims, review volume and rating, ingredient transparency, expert endorsement | Trust badges lift purchase intent by 23% among first-time buyers (Kantar, 2024). |
P5: Brand storytelling and differentiation | Origin narrative, values visibility, category differentiation, emotional resonance, cross-sell | Purpose-driven brands convert 18% better with values-aligned buyers (Kantar, 2024). |
P6: Mobile experience and UX | Text legibility, visual hierarchy on scroll, A+ content stacking, thumbnail performance, carousel engagement | Structured gallery narratives drive 23% longer dwell time on mobile (Baymard). |
P7: Category-specific lens | Purchase barrier reassurance, target population clarity, usage/dosage clarity, claims communication, regulatory compliance | Visual reassurance outperforms text-only claims by 47% (Baymard). |
Pillar 1: Hero image quality
The hero image is the single most important visual asset on your Amazon listing. It is what appears in search results, in ads, in recommendations, and at the top of your PDP. Baymard Institute research confirms it is viewed by more than 95% of all PDP visitors.
Amazon's requirements are non-negotiable - pure white background, product filling at least 85% of the frame, no text or graphics overlay, minimum 1,000 pixels on the longest side (1,600+ recommended for zoom functionality). Listings that violate these rules risk suppression.
But compliance is table stakes. The hero image also needs to work as a conversion asset in the search grid, where it competes for attention at thumbnail scale (roughly 150 pixels).
Five criteria to score
Technical compliance - Pure white background, correct dimensions, zoom-eligible resolution. Non-compliant heroes are deprioritized in search results and ineligible for Sponsored Products.
Photography quality and lighting - Professional, consistent lighting. Baymard identifies lighting consistency as the top driver of perceived product quality in supplement and CPG categories.
Product clarity and identity - The product must be instantly recognizable at 150px thumbnail. Amazon's A10 algorithm weights CTR, and product identity must register within 300ms at thumbnail scale (Nielsen).
CTR optimization - Color contrast, credential badges ('#1 in Category', 'Amazon's Choice'), and distinctive packaging create differentiation in the search grid. Strong color contrast can improve CTR by up to 20% (Amazon seller data).
Format and size accuracy - Each variant (size, count, color) must have a matched, accurate hero image. Mismatches cause listing suppression and elevated return rates.
Here are a few examples of products that score high in Pillar 1.
 |  |  |
Pillar 2: Image gallery depth and strategy
After the hero captures attention, the gallery tells the full product story. Amazon allows up to 9 image slots, and every slot you leave empty is a conversion argument you are not making.
The data is clear on sequencing. Gallery slots 2-4 receive 3x more engagement than slots 5+ (Baymard). This means your strongest selling points, whether that is clinical evidence, competitive comparison, or lifestyle context, must appear in the first three gallery images after the hero.
Five criteria to score
Slot utilization - Fill every available slot. Listings with 6+ images achieve approximately 12% higher conversion than those with fewer than 5 (Jungle Scout, 2024). Near-duplicate shots waste slots and reduce total persuasion surface.
Lifestyle imagery - Show the product in real-world use with people who match your target demographic. Lifestyle imagery increases brand recall by 31% vs. product-only galleries (Nielsen, 2023).
Feature infographics and callouts - Dedicate images 2-4 to your primary benefit claims with clear visual hierarchy. Comparison infographics in gallery positions 2-5 are the highest-converting single asset type in most consumer categories.
Ingredient or provenance imagery - For supplements, food, beauty, and personal care, "ingredient origin stories" are a top trust signal for the 45-65 buyer (Mintel, 2024). For hard goods, this translates to materials, sourcing, and manufacturing process imagery.
Video presence - Video in the gallery increases conversion by up to 9.7% (Amazon). Consumer testimonial video outperforms brand film by 14% on purchase intent. Fill at least one video slot.
📐 The 7-step gallery narrative arc
The highest-converting galleries follow a deliberate sequence. Each image earns the next scroll. PDPs with a deliberate 6-8 image narrative arc outperform 3-5 image galleries by 12% on repeat purchase rate, with the effect amplified on mobile (Feedvisor).
Slot | Purpose | What to show | |
|---|---|---|---|
1 | Hero | Product on white, compliant, zoom-eligible |  |
2 | Primary proof | Your strongest claim with evidence (clinical data, performance stat, award) | 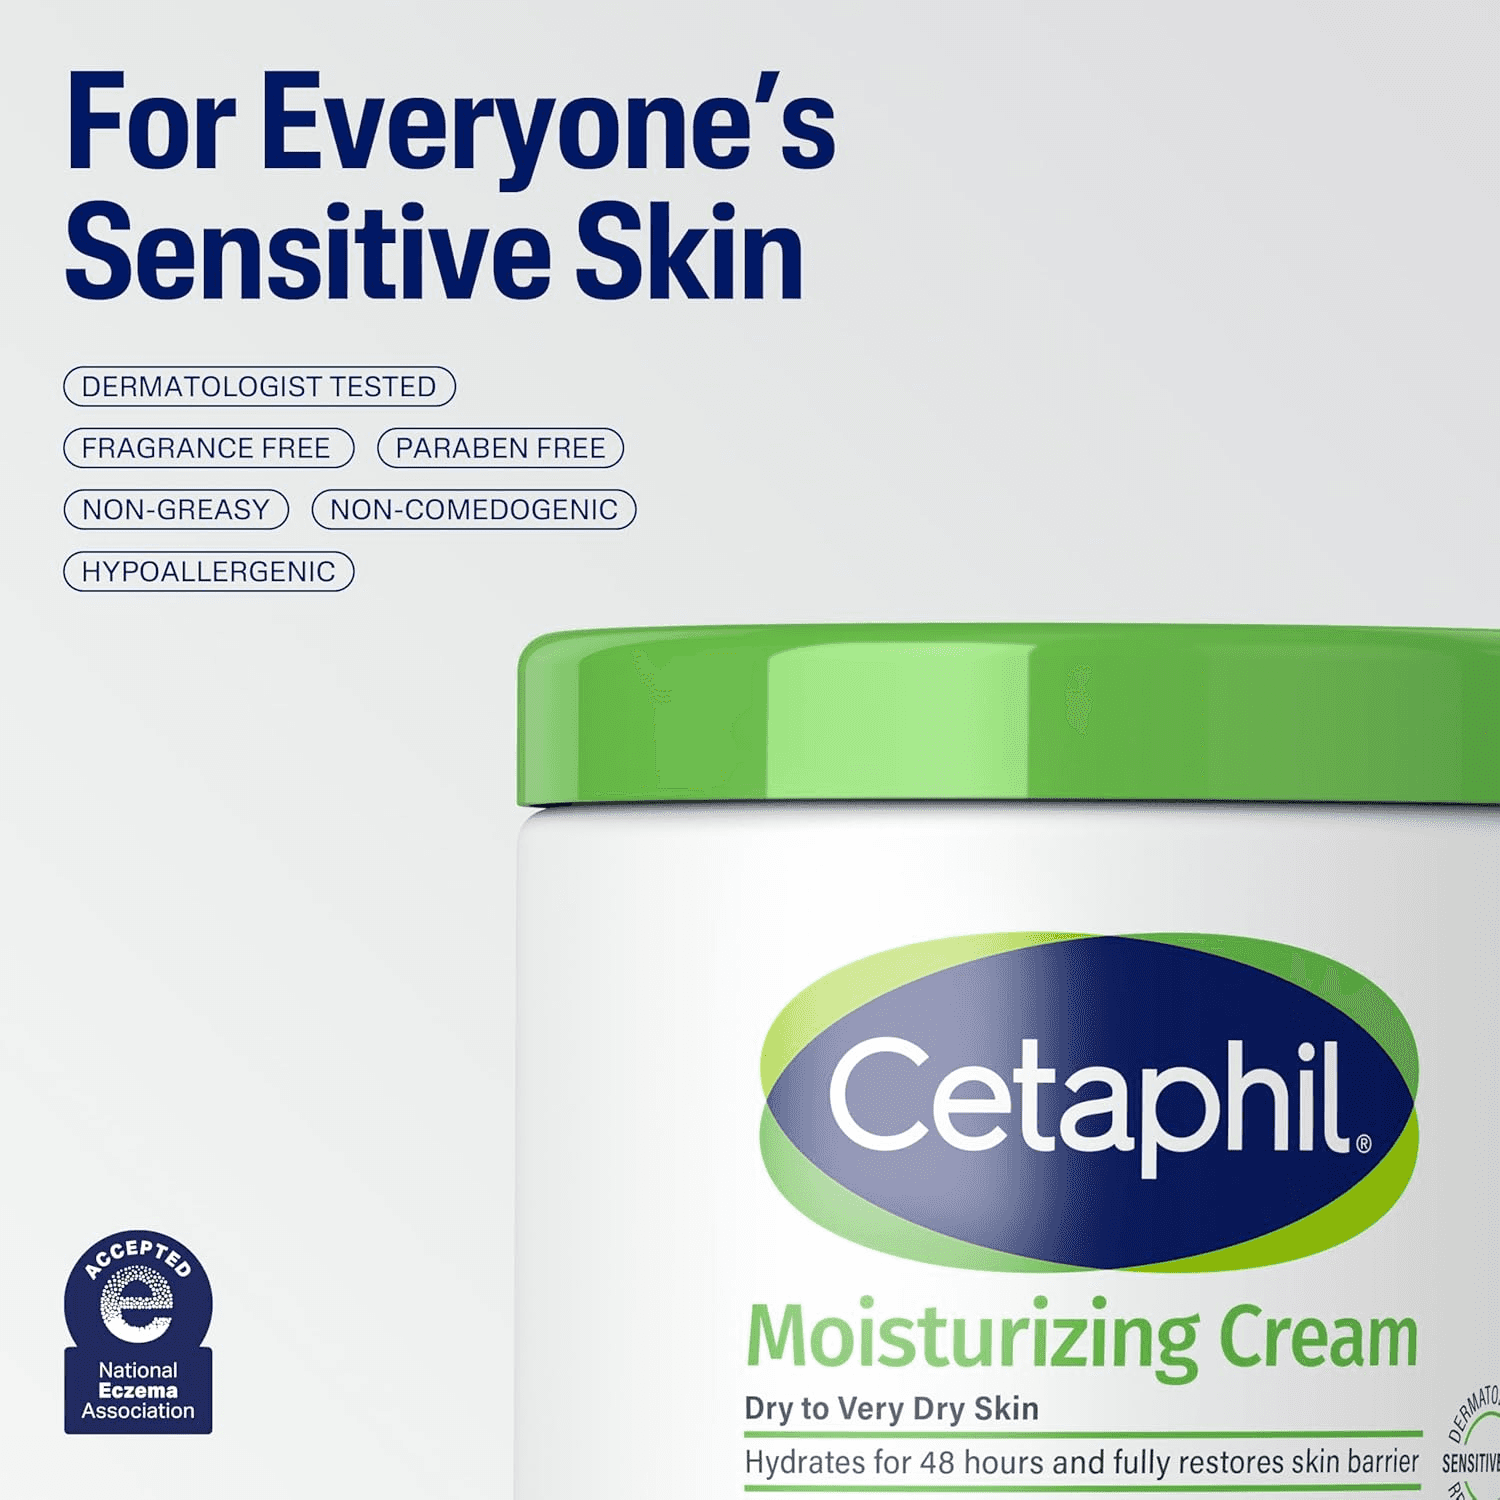 |
3 | Key differentiator | What makes you different from the next 5 results in search | 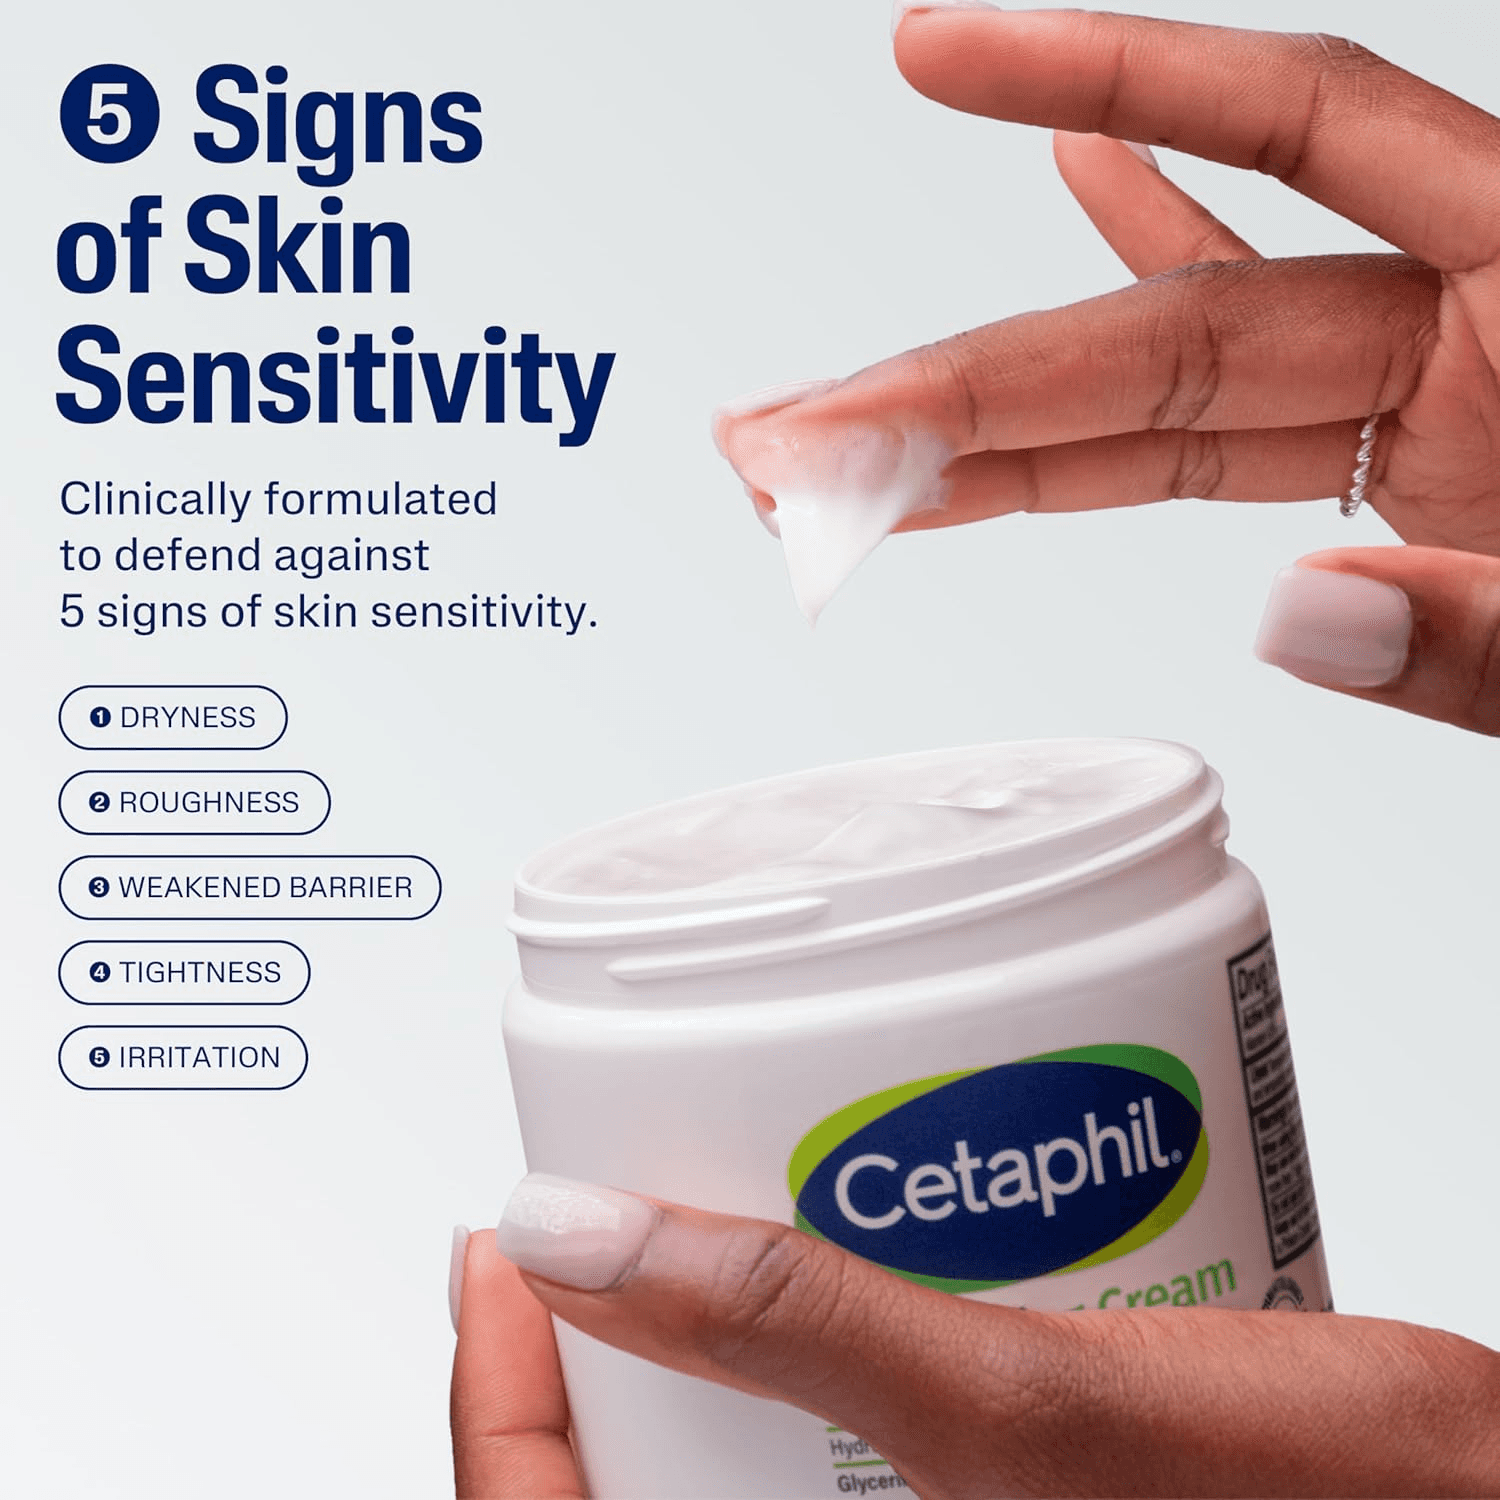 |
4 | How it works | Ingredients, mechanism, usage instructions with visuals | 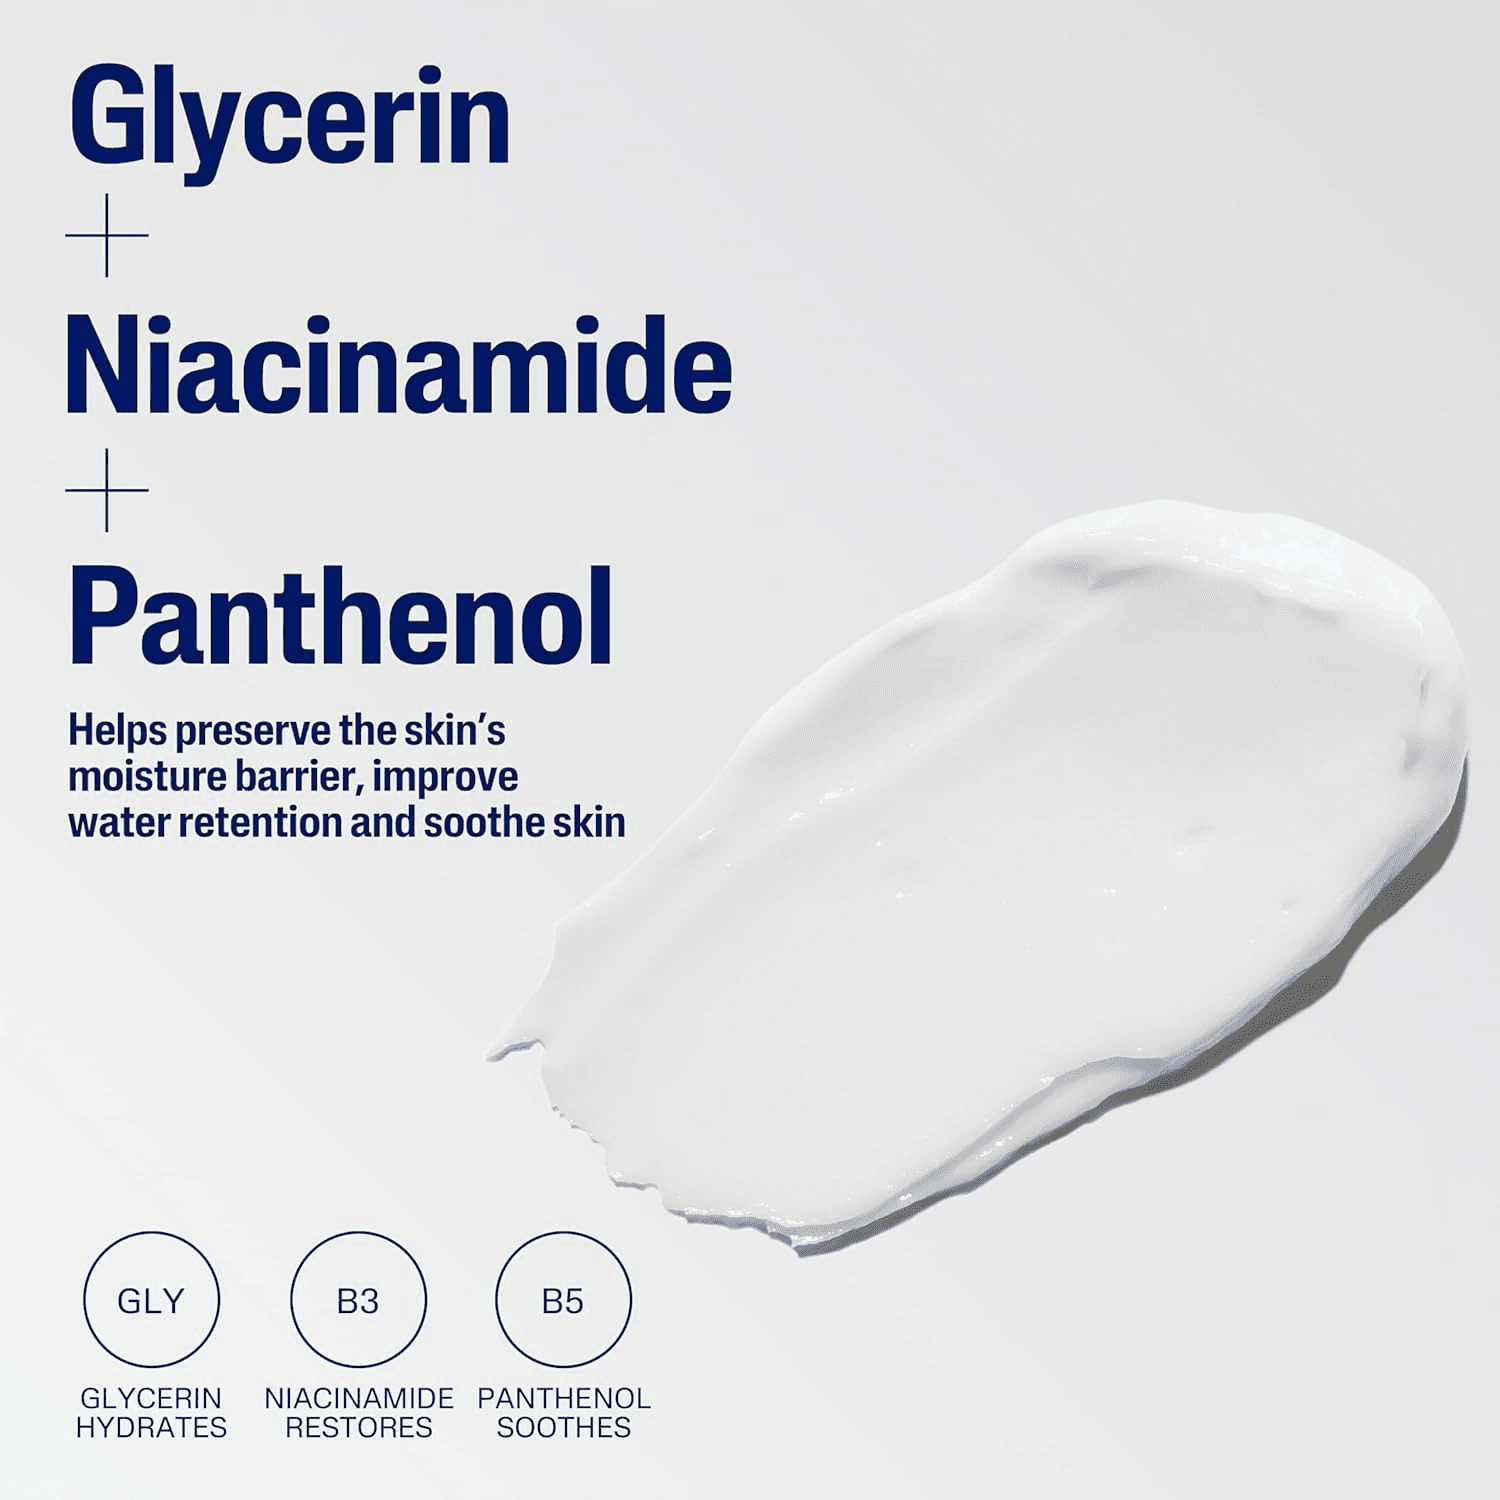 |
5 | Social proof or comparison | Review highlights, certification badges, or comparison to alternatives |  |
6 | Lifestyle or usage context | Real-world use by your target demographic | 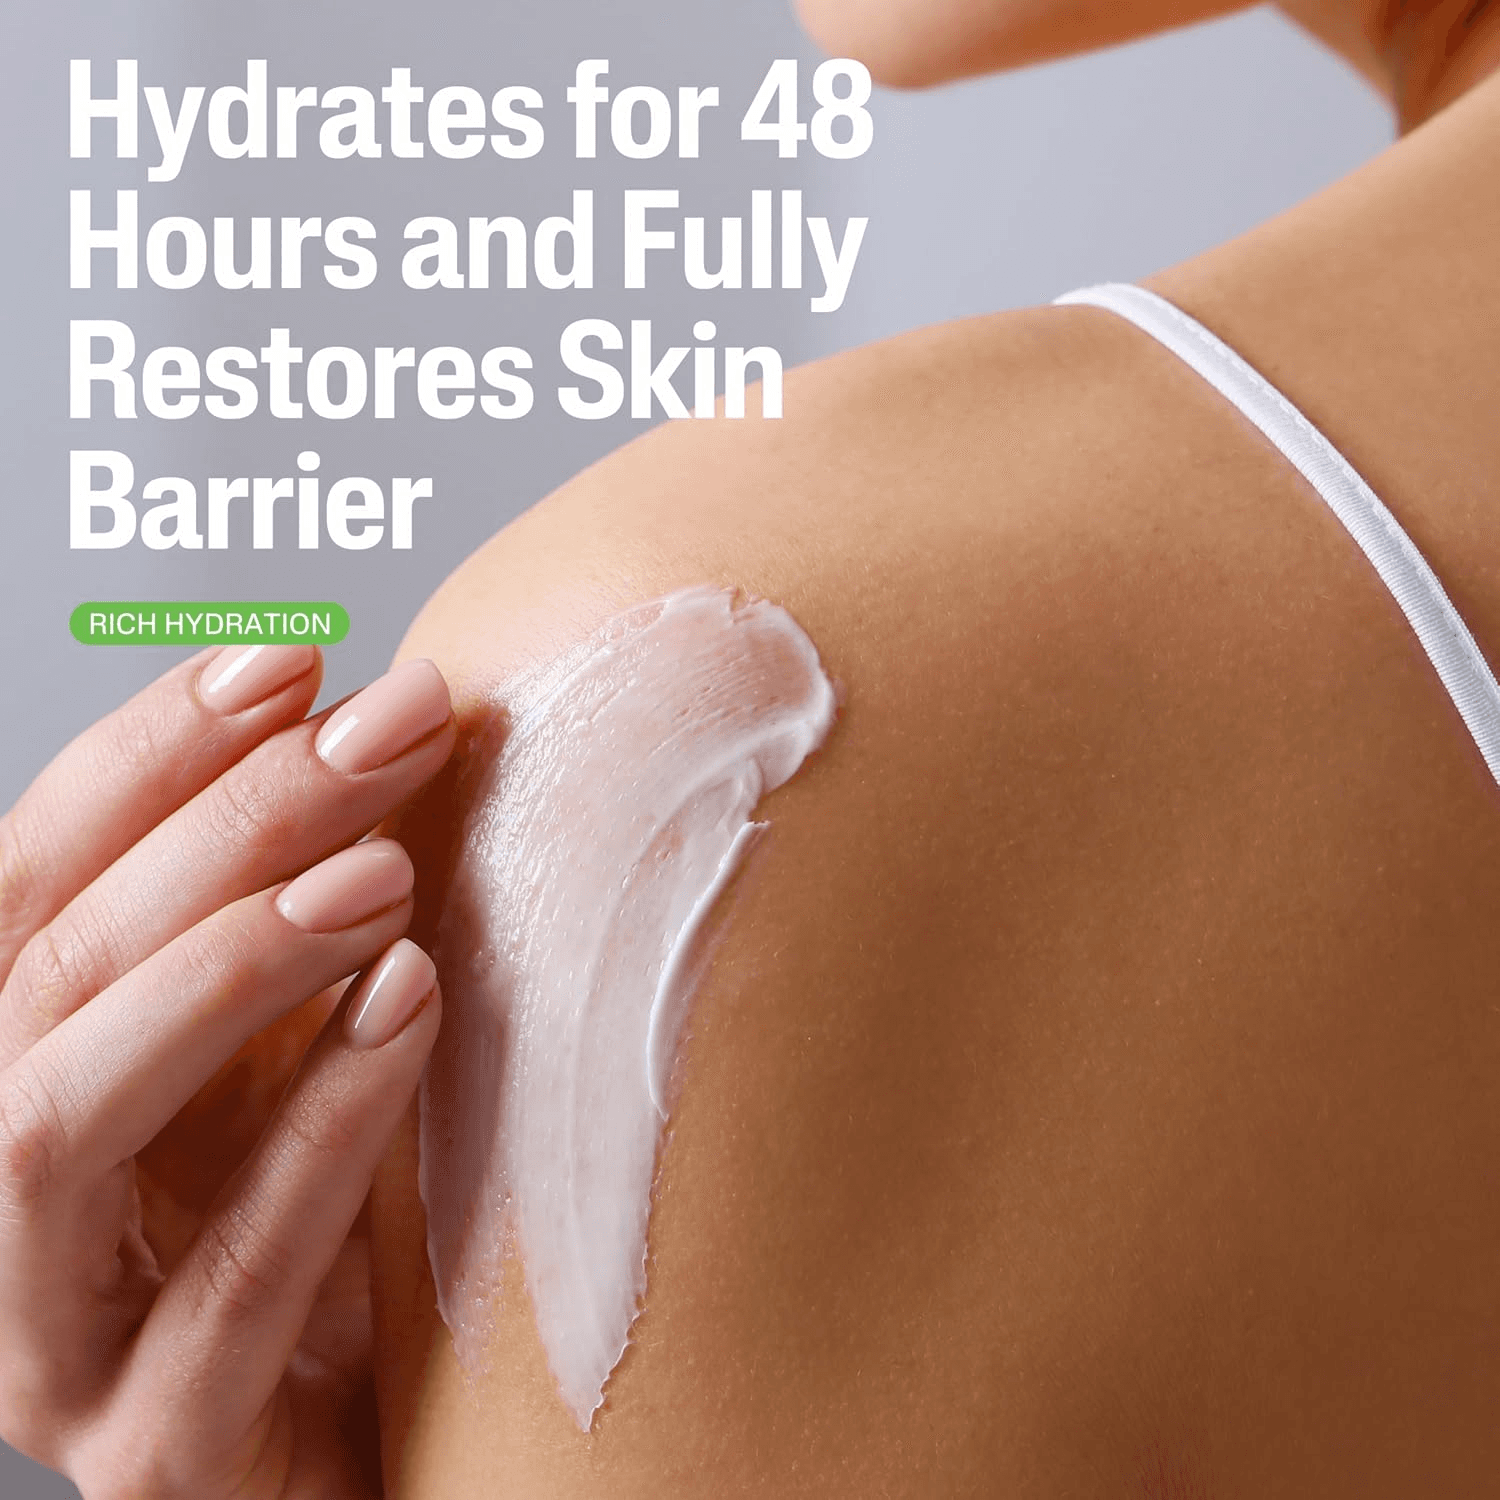 |
7-9 | Product family, certifications, or video | Cross-sell variants, full certification suite, or an explainer/testimonial video |  |
Pillar 3: A+ content quality and completeness
A+ content (formerly Enhanced Brand Content) is the long-form persuasion surface below the fold. Amazon's own data shows it correlates with a 3-10% conversion uplift vs. listings without it. For any brand with more than a few hundred reviews, it is table stakes.
The most underused A+ module is the comparison chart. 37% of shoppers abandon a PDP when they cannot determine which product variant fits their specific need (Baymard). A comparison chart that covers 5+ attributes across your product family helps shoppers self-select and reduces bounce to competitors. Listings with comparison charts show 11% higher add-to-cart rates (Feedvisor).
Five criteria to score
A+ content present and live - Implementations with 5+ modules achieve close to the maximum conversion uplift. Fewer than 3 modules signals incomplete execution.
Visual quality and module design - Consistent visual identity across all A+ modules increases brand recall by 3x (Nielsen, 2023). Color palettes, typography, and photography style must be cohesive.
Comparison chart - The highest single-module conversion driver. Must compare your own variants (not competitors, per Amazon policy) across 5+ attributes. If you do not provide one, Amazon may show Sponsored Products from your competitors in the space below your description.
Brand Story module - Brand origin, mission, and values content. Purchase intent increases 12% with brand-provenance content for health-conscious consumers (Forrester).
Mobile optimization of A+ - Amazon renders A+ in single-column format on mobile. Side-by-side modules that are not mobile-optimized collapse or distort, reducing engagement by up to 40% (Feedvisor, 2023).
Here is an example A+ module that highlights different product variants.
 |  |  |
Pillar 4: Trust signals and credibility
Trust determines whether a shopper adds to cart or keeps scrolling. The specific trust signals that matter depend on your category, but the pattern is consistent: third-party verification outperforms self-reported claims, named endorsements outperform anonymous ones, and specificity outperforms vagueness.
71% of supplement buyers cite third-party testing as a top purchase driver, outranking brand heritage and price (Mintel, 2024). In electronics, certifications like UL, FCC, and CE serve a similar function. In beauty, dermatologist-tested and cruelty-free badges play the equivalent role.
Five criteria to score
Third-party certifications - Independent verification (Non-GMO Project, NSF, USP, B Corp, USDA Organic, dermatologist-tested) displayed prominently in images 2-3 and throughout A+ content. Trust badges lift purchase intent by 23% among first-time buyers (Kantar, 2024).
Scientific or performance claim communication - Claims must be specific and evidenced. "Clinically proven" with a cited study outperforms "doctor-approved." PubMed-indexed evidence increases purchase intent by 34% vs. unsubstantiated claims (AARP Health Study, 2022).
Review volume and star rating - Amazon's A9 algorithm gives meaningful BSR weight to review velocity and rating. Category-specific thresholds apply (1,000+ reviews for supplements, 500+ for most CPG).
Ingredient or materials transparency - Named ingredients with mechanisms of action outperform generic ingredient lists. Full transparency is the top trust driver for women 40+ buying supplements, and a strong signal across beauty and personal care categories (Euromonitor, 2024).
Expert or practitioner endorsement - Named, credentialed endorsements (MD, RD, dermatologist) command 29% higher perceived safety scores than anonymous "advisory board" references (Mintel Health, 2024).
Trust signal type | Impact on purchase intent | Best placement |
|---|---|---|
Third-party certification badges | +23% (Kantar, 2024) | Gallery images 2-3, A+ content |
Named expert endorsement | +29% perceived safety (Mintel, 2024) | Brand Story module, gallery image |
Published clinical or performance data | +34% (AARP, 2022) | Gallery infographic, A+ module |
Review volume above category threshold | Meaningful BSR and search weight | Organic (not directly controllable) |
Ingredient/material transparency | #1 trust driver for 45-65 female buyers (Euromonitor) | Gallery image, A+ module |
A few examples of images showing strong trust signals.
 |  |  |
Pillar 5: Brand storytelling and differentiation
When every competitor in your category makes similar functional claims, purchase decisions shift to brand resonance. Values, heritage, and emotional connection are increasingly decisive, particularly among mission-aligned buyers.
58% of women 40-60 prefer brands that communicate social responsibility on their product pages (Euromonitor, 2025). Purpose-driven brands command a 12% price premium and convert 18% better (Kantar, 2024). These numbers apply across beauty, personal care, food, and household categories.
Five criteria to score
Origin and heritage narrative - Brands with 10+ years of visible history score 18% higher on consumer trust (Kantar). Heritage is an underused asset for many established brands whose PDP does not mention when they were founded.
Values and mission visibility - Sustainability credentials, social responsibility, and brand purpose. 44% of women 40+ say values alignment influences their purchase choice (Euromonitor, 2024).
Differentiation from category - What do you have that the next 5 search results do not? A proprietary ingredient, a unique mechanism, a specific population focus. "Owned ingredient" positioning is the top predictor of brand loyalty in any category where products are perceived as interchangeable.
Emotional resonance - Does the listing connect with the buyer's identity and life stage? Emotional brand connection increases repeat purchase rate by 2.3x (Nielsen Health Panel, 2023).
Cross-sell and product family - A+ comparison tables covering your full product family increase average order value by 15-20% (Amazon). Shoppers who find the right variant on your PDP are less likely to compare competitors.
Here are some images that show the history, mission, and product family display.
 |  |  |
Pillar 6: Mobile experience and UX
More than 53% of Amazon purchases happen on mobile devices (Amazon Prime Day, 2025). Your listing must be evaluated against the mobile viewport first, not as an afterthought.
The mobile experience differs from desktop in three critical ways. Gallery images are smaller, so text overlays must be larger (14pt minimum at 360px viewport). A+ content renders in single-column format, so side-by-side modules collapse. And shoppers scroll faster, so your primary claims must land in gallery images 1-3 or they will be missed entirely.
Five criteria to score
Image text legibility on mobile - All text overlays in gallery images and A+ content must be readable at 360px viewport width. Text below 14pt becomes illegible on the majority of Android devices (Baymard).
Visual hierarchy on mobile scroll - Primary claims (your strongest proof point, your key differentiator) must appear in images 1-3 to achieve baseline message delivery. Shoppers scroll past the fold in 3-5 seconds on mobile.
A+ content mobile stacking - All modules must render correctly in single-column format. Non-optimized side-by-side modules see up to 40% reduced engagement on mobile (Feedvisor, 2023).
Thumbnail performance in search - How does your hero look in the mobile search grid at 150px? Credential badges plus distinctive brand color improve mobile search CTR by up to 20% (Amazon A/B data).
Image carousel engagement design - Deliberate narrative progression (problem, solution, proof, social validation) outperforms unorchestrated galleries by 8-12% on CVR (Amazon A/B data). The effect is amplified on mobile where every swipe counts.
📱 Quick mobile audit checklist Open your listing on a phone and answer these five questions in under 60 seconds:
If any answer is no, that is where to start. |
Pillar 7: Category-specific lens
General PDP best practices are necessary but not sufficient. Every product category has specific purchase barriers, compliance requirements, and visual expectations that must be addressed in the image and A+ layer.
In baby, beauty, and health, the primary purchase barrier is fear of side effects, cited by 64% of first-time buyers (Mintel, 2024). Visual reassurance outperforms text-only claims by 47% (Baymard). For apparel, the primary barrier is sizing uncertainty. For electronics, it is compatibility and durability. For food, it is ingredients and allergens.
The category lens requires tailoring your gallery and A+ content to explicitly address whatever your category's top 2-3 purchase barriers are, in the visual layer, not buried in bullet points.
Five criteria to score
Primary purchase barrier reassurance - The #1 reason shoppers in your category hesitate must be addressed visually in the first 3 gallery images. Identify this through review analysis, customer questions, and category research.
Target population clarity - Who is this product for? Population specificity increases self-identification and reduces comparative shopping (Kantar, 2023). Vague targeting ("for everyone") dilutes conversion.
Usage, setup, or dosage clarity - Clear instructions reduce returns. Unclear usage is cited by 18% of supplement returners as a primary dissatisfaction driver (Baymard). This applies to any product with a non-obvious usage pattern.
Category-specific claims communication - Free-from, allergen, compatibility, warranty, and other category-standard claims must be visually prominent. 67% of supplement buyers verify free-from claims before purchasing (ConsumerLab, 2024).
Regulatory compliance in visual claims - Claims must comply with category-specific regulation (FDA for supplements, FTC for performance claims, Amazon's own policies). Non-compliant claims create both legal and listing-suppression risk.
Category | Primary purchase barrier | What to show visually |
|---|---|---|
Health | Side effect anxiety (64% of first-time buyers, Mintel 2024) | Clinical trial results, "no adverse effects" infographic, free-from badges |
Apparel | Sizing uncertainty | Size chart infographic, model measurements, fit comparison images |
Electronics | Compatibility and durability | Compatibility chart, drop-test or durability imagery, warranty badge |
Food and beverage | Ingredients and allergens | Ingredient sourcing, allergen-free badges, nutrition facts close-up |
Beauty and personal care | Skin sensitivity and results timeline | Dermatologist-tested badge, before/after (if compliant), ingredient provenance |
Home and kitchen | Size relative to space | Lifestyle image showing product in a real room, dimensions overlay |
How to score your own listings
Step 1 - Audit your top 10 SKUs. Score each listing across all 35 criteria on a 1-5 scale. Be honest. A score of 3 means "meets minimum expectations." A score of 5 means "best-in-class for the category." Total possible: 175 points per listing.
Step 2 - Audit your top 2-3 competitors. Score them using the same criteria. The value of this framework is not your absolute score but how you compare to the listings your shoppers are comparing you to. If you score 120 and your closest competitor scores 145, you know exactly where the gap is.
Step 3 - Prioritize the largest single-pillar gaps. Do not try to fix everything at once. Identify the one pillar where you score lowest relative to your best competitor. Fix that first. Then move to the next largest gap.
Score range | Rating | What it means |
|---|---|---|
140-175 | Best-in-class | Your listing is at or near the top of your category. Focus on maintaining and testing incremental improvements. |
105-139 | Competitive | Solid foundation with specific gaps that are costing you conversions. 2-3 targeted fixes can move you to best-in-class. |
70-104 | Below average | Material gaps across multiple pillars. Competitors with stronger listings are likely capturing share you should own. |
Below 70 | Poor | Listing needs a full rebuild. Consider it a relaunch, not an optimization. |
How to use the audit results
Create or update assets identified by the audit
The audit is a diagnostic, not a deliverable. It tells you what to fix, not how to fix it. Once you have identified the gaps, the production work (new gallery images, updated A+ content, new infographics, video) needs to happen fast enough to capture the improvement before the next competitive shift.
Rocketium AI Studio helps with this type of audit and produces the assets identified by it. Its capabilities are:-
Versioning - adapts assets, designs, and copy to all required sizes and formats while staying compliant with your brand and Amazon’s guidelines
Production - creates new copy, transcreations, lifestyle or product imagery, and videos
Concepting - crafts new gallery narrative arcs, base design templates, and video storyboards
Used together, Rocketium AI Studio can help you deliver all the asset updates you need in a matter of days.
Run the audit periodically
Amazon listings are dynamic. Competitors update, Amazon changes policies, seasonal shifts alter what shoppers expect. Re-score your top listings:
Quarterly for your top 10 revenue SKUs
After any major competitor PDP update
Before and after seasonal peaks (Prime Day, Black Friday, Q4)
After any algorithm change announcement from Amazon
Brands that treat PDP optimization as a continuous discipline, not a one-time project, consistently outperform those that "set and forget" their listings.
Frequently asked questions
➤ How many images should I have on my Amazon listing?
Fill every slot. Amazon allows up to 9 images depending on the category. Listings with 9 images achieve approximately 18% higher conversion than those with 5-6 (Jungle Scout, 2024). Every empty slot is a conversion argument you are not making.
➤ Does A+ content actually improve conversion?
Amazon's own data shows A+ content correlates with a 3-10% conversion uplift. The uplift is highest for implementations with 5+ modules, a comparison chart, and a Brand Story module. Basic implementations (1-2 modules, no comparison chart) see minimal lift.
➤ How do I know which pillar to fix first?
Score your listing and your top 2-3 competitors. The pillar where you have the largest gap relative to the best competitor in your category is where to start. Trust signals (P4) and A+ content (P3) are the most commonly underleveraged pillars.
➤ Can I do this audit myself or do I need a tool?
You do not need to be a Creative Scientist to do this audit. All you need is this framework, a spreadsheet, and some elbow grease. Score each criterion 1-5, total the pillar scores, and compare against competitors. The audit itself takes 30-60 minutes per listing. The production work to close the gaps is where most teams need help, because a single audit can identify 50-100 new assets that need to be created.
For context: a typical agency delivers PDP asset updates in 5-10 business days per SKU. AI Studio delivers it in hours. At 10+ SKUs, the difference in execution speed determines whether the audit insights reach your listing this quarter or next.
➤ How do I handle category-specific requirements?
Pillar 7 requires category research. Analyze the top 10 listings in your category for common patterns: what trust signals do they show? What purchase barriers do they address visually? What certifications are standard? Then score your listing against that category standard, not against a generic benchmark.
Book a 15-minute call to see how AI Studio can produce the assets your audit identifies →
